Download
1 / 65
650 likes | 771 Views
GIS as an Administrative Decision Support System for Planning at Fayetteville Public Schools. Using GIS for Student Enrollment Projection. The Data: Student Enrollment Projection.

E N D
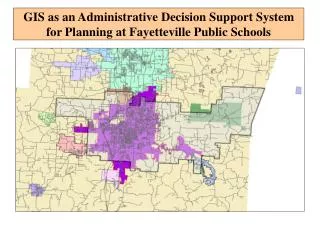
GIS as an Administrative Decision Support System for Planning at Fayetteville Public Schools
The Data: Student Enrollment Projection Gathering data for an enrollment projection for the Fayetteville School District is challenging because of the geographical nature of the data sources. A substantial portion of the City of Fayetteville falls within the Fayetteville School District, yet not all the inhabitants reside within the district. It is estimated that 90% of the residential units are located within the Fayetteville School District boundaries. The school district is located within Washington County. Based on the County Assessor’s data, some 39% of the improved, non-vacant residential units are located within the boundaries of the school district. The available data sources include: U.S. Census Bureau statistics for Washington County Northwest Regional Planning Commission (NWARP) City of Fayetteville’s Plan 2020 City of Fayetteville Planning Office and the Office of Geographical Information Systems Arkansas Geographic Information Office (AGIO) GeoStor (University of Arkansas CAST ) Arkansas Department of Education (ADE) Washington County Assessors Office Washington County 911 Office Fayetteville School District, and first hand personal observation. However, not all of the data from the City, Census Bureau and the Regional Planning Commission is completely accurate or applicable to the Fayetteville School District. In addition, the data obtained from the ADE may not take into account all of the unique factors that influence area growth at this time.
Location of Platted Housing Developments Area Platted Housing Dots are Lots Squares are units
Segmented The School District is Segmented Reflecting Neighborhoods Transportation and safety was a major factor in deciding where to segment the district.
2000-2003 Transition Bridgeport Phase III Sub-division: Timeline of Growth 2003 SAT Image 2000 Air Photography
Students in Bridgeport There are 21 students residing in the Bridgeport sub-division as of January 2004 21 Students 8 Students As of October 2004 there are 30 students. 5 Students
Number of New Housing Units and Lots New Housing with Number and Type Depicted
Housing Value Housing Total Assessed Value
Distance .76 miles from nearest school
Bridgeport Analysis Looking at the 2000 air photograph, Bridgeport was an open field with no activity. The City of Fayetteville mapped the sub-division with 99 platted single family lots, and presented it to the Fayetteville School District in September 2002. Some construction was underway, and it is assumed that development of Bridgeport was sometime in 2001. In October 2002, some 5 students resided in Bridgeport. The Fayetteville School District purchased a satellite image of the district and in July 2003. As of October 2003, some 20 students resided in Bridgeport showing 59 structures completed construction, with 31 open lots. As of January 2004 there were 21 students residing in the Bridgeport subdivision. Based on the number of housing units built and the residing students as of October 2003, the student to housing ratio was 1 student for every 2.8 housing units. The cost of the housing runs from $200,000 to $300,000, according to the developer. The properties are zoned R-1 or RSF-4. Thus, from 2000 to 2003, the Bridgeport sub-division went from an un-developed field to a development of 59 single family houses with 20 residing students. Note: This analysis is for this specific sub-division.
Housing Types Multi-Family Commercial & Industrial Duplex-Triplex & Mobile Homes Single Family
Calculating Students from Proposed Housing The assumption that “where there are houses, there are students” is a simple method of projecting student enrollment. Many school districts simply estimate one new student per dwelling unit. However, the following study may suggest the type of housing could determine how many students can be expected for new housing starts. The Bridgeport Analysis demonstrated the method for examining one sub-division. The study that follows looks at several sub-divisions and other forms of housing types to generate a general student-to-housing ratio.
Student to Housing Ratios: Samples Schools Single Family Mobile Homes Duplexes Apartments Census Bureau 2000 Percentage of Poverty Over 20%: The darker, the higher
Census 2000 Census 2000 Average House Hold Size
Results of Samples Single Family Homes: Of some 13 sample areas, the Student to Housing Ratio is 1 to 2.6. Duplexes: Of 10 sample areas, the Student to Housing Ratio is 1 to 3. Apartments: Of 11 sample areas, the Student to Housing Ratio is 1 to 3.92. Mobile Home Parks: Of 8 sample areas, the Student to Housing Ratio is 1 to 2.62. Note: The inner part of the City of Fayetteville has a higher concentration of apartments while the growth of single family homes are being built east and west of the center of the city. The apartments in the inner area of the city are heavily populated with University of Arkansas students who tend not to have school aged children. It is therefore assumed that the ratio for the apartments will be higher for the overall number than the samples suggest above.
Locating Student Growth One 30 year employee of the Fayetteville School District told me that she use to track where their elementary students lived by placing pins in a map. We do the same electronically for the entire district with GIS. In the past, the district did not have a good idea of which students lived in the boundaries of the district or a certain attendance zone. In an area where growth is rapid, this becomes a monumental task. Many school districts accept intra-district transfers from other school districts. Determining how many students resided within the district became confusing. With GIS, the task becomes simple, delivering more accurate information to school administrators. Between 2002 and 2003, total enrollment, by simple count, appeared to increase by 40 students. However, using GIS, the district has an increase of 148 students residing within the school district. With a restrictive transfer policy, the number of out of district students dropped while students residing within Fayetteville increased due to a housing boom.
October 1st 2002 Fayetteville Students Residing In District In Zone 2002
In Zone 2003 October 1st 2003 Fayetteville Students Residing In District
Observed Growth Growth Areas Against K-5 Zones August 2004 students mapped to new housing points.
Ratio study There were 3 houses in 2000. There were 3 students residing in this subdivision in October 2002. There were 21 houses in July of 2003 with 10 students in October 2003. There were 69 houses in the first half of 2004 with 18 students in October 2004. The number of students in 2000 and the number of homes in 2002 were assumed.
Location of Where Students Reside Last Year and This Year There was growth in the school district, specifically within the City of Fayetteville while the administration restricted intra-district transfers.
School District Data The first objective in implementing a GIS in a school district is to obtain accurate student data. To accomplish this, a map reader (ArcExplorer) was installed on all of the school secretary’s PC for determining with accuracy the student’s correct attendance zone and to obtain an accurate address for the student. This data is entered into the student’s electronic record. This was essential for geocoding the 8,000 plus students. Two years ago, a batch mapping of the students was at a 56% map rate. After a data cleanup, the rate rose to 90%. The district also utilizes ArcIMS on the district homepage for the public and local realtors correctly determine if the resident is in the school district or which attendance zone they reside.
Locator New-comers to the District could locate which attendance zone they reside in by accessing this information over the internet.
GIS in Practice: The Jefferson Elementary Issue As a part of the Fayetteville School District’s Capital Improvement Plan Project, it was decided that an old elementary school, named Jefferson Elementary, cost more to maintain than it would to build and maintain a new facility over a ten year period. In addition to this factor, due to area growth, the district’s student enrollment was projected to grow by 400 elementary student by the year 2007. So it was decided to replace Jefferson with a larger elementary school to accommodate this projected growth. However, after a public meeting on this issue, the poverty of the student population was raised as a serious concern. The number of Free & Reduced students, a common standard for determining economically challenged students or impoverished students, changed the analysis of the Capital Improvement Plan. Jefferson had a student population with 87% Free & Reduced students with a district average of 30%. GIS was employed to re-draw the elementary attendance zones to reduced this percentage. Jefferson elementary is located in the south part of the City of Fayetteville and in the south and southwest portion of the school district.
Decision AnalysisFor the Jefferson Issue Growth Management Equity Consideration Build school to service the future growth. Level the disparity in the percentage of economically challenged K-5 students. Economic Efficiency Long term capital plan for existing and new resources: Building a new, larger school to replace an older high maintenance building as a sound economic decision.
K-5 Zones Elementary Attendance Zones
Residing in Jefferson January 2004 Students Residing in the Jefferson Zone
Percent Fayetteville Population Below Poverty Level Based on US Census 2000 Census Poverty
Percent F&R Percent of Economically Challenged Students by Planning Zone
New Housing Plat Housing Points: Potential New Housing Locations
K-5 Student Growth Projected K-5 students over the next 3-4 yrs.
An Impervious Surface Map of the Jefferson Zone Jefferson Zone
West Location This spot was found to meet all of the criteria for a new school site.
Bus Route Planning By using GIS to map bus routes, school transportation managers can better plan bus routes. By using shape files of the students who ride the buses, proposed streets, and new sub-divisions, school buses can be routed with greater efficacy. Perhaps the most effective result of using GIS for school transportation planning is that it is a good tool for finding weaknesses in transportation practices and policies. Using GIS in conjunction with an AVL system for buses, transportation managers and administrators can have a real-time perspective of what is happening on the road.