Download
1 / 52
530 likes | 679 Views
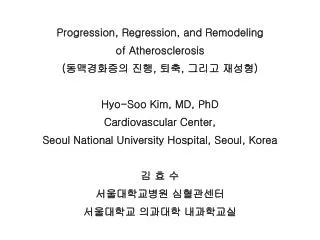
Regression of atherosclerosis and related CV diseases. Jean-Claude Tardif MD , FRCPC, FACC, FCAHS Director, MHI Research Center Professor of Medicine UdeM Endowed Research Chair in Atherosclerosis Montreal Heart Institute Université de Montréal.

E N D
Regression of atherosclerosis and related CV diseases Jean-Claude Tardif MD, FRCPC, FACC, FCAHS Director, MHI Research Center Professor of Medicine UdeM Endowed Research Chair in Atherosclerosis Montreal Heart Institute Université de Montréal
Change in atheroma volume in 6 weeks in statin-naïve patients Relative change Nominal change 0 2 1.21 -0.5 -0.54 ± 0.89 0 -1 -1.5 -2 -2 Median (IQR) Adjusted mean ± SE -2.5 -4 -3 P = 0.002 -6 -3.5 P = 0.003 -4 -8 -4.5 -9.10 -4.71 ± 0.96 -5 -10 Chronic statin therapy prior to ACS (n = 38) Newly initiated statin therapy following ACS (n = 36) Chronic statin therapy prior to ACS (n = 38) Newly initiated statin therapy following ACS (n = 36) Rodes J and Tardif JC, Am J Cardiol 2009;104:750-7
Substantial Risk of CHD Events Remains for Many Patients on Statin Therapy aNonfatal myocardial infarction and coronary heart death; bPrimary prevention trial; cSecondary prevention trial WOSCOPS=West of Scotland Coronary Prevention Study; AFCAPS/TexCAPS=Air Force/Texas Coronary Atherosclerosis Prevention Study; ASCOT-LLA=Anglo-Scandinavian Cardiac Outcomes Trial–Lipid Lowering Arm; 4S=Scandinavian Simvastatin Survival Study; CARE=Cholesterol and Recurrent Events; LIPID=Long-Term Intervention with Pravastatin in Ischemic Disease; HPS=Heart Protection Study; PROSPER=Prospective Study of Pravastatin in the Elderly at Risk Adapted from Mahley RW, Bersot TP. In: Goodman & Gilman’s The Pharmacological Basis of Therapeutics. 11th ed. New York: McGraw-Hill Medical Publishing Division, 2006:933–966; Bays HE. Expert Rev Cardiovasc Ther. 2004;2:485–501; Shepherd J et al. N Engl J Med. 1995;333:1301–1307; Downs JR et al. JAMA. 1998;279:1615–1622; Sever PS et al. Lancet. 2003;361:1149–1158; Scandinavian Simvastatin Survival Study Group. Lancet. 1994;344:1383–1389; Sacks FM et al. N Engl J Med. 1996;335:1001–1009; Long-Term Intervention with Pravastatin in Ischaemic Disease (LIPID) Study Group. N Eng J Med. 1998;339:1349–1357; Heart Protection Study Collaborative Group. Lancet. 2002;360:7–22; Shepherd J et al. Lancet. 2002;360:1623–1630.
Risk of death according to presence of metabolic syndrome Survival (all-cause) Survival (CV) 1.0 1.0 p < 0.0001 p < 0.0001 0.75 0.75 0.50 0.50 0.25 0.25 No WHO metabolic syndrome WHO metabolic syndrome No WHO metabolic syndrome WHO metabolic syndrome 0 0 0 5 10 15 20 0 5 10 15 20 Time (years) Time (years) No at risk No MS MS 23813 1078 20796 877 17854 673 10978 388 23122 1054 20110 853 17233 651 10611 376 Nigam A, Bourassa MG, Fortier A, Guertin MC, Tardif JC. Am Heart J 2006; 151: 514-21
Lipoprotein metabolism LDL receptor Liver B C-II ACAT MTP LPL C-II FC CE B B ApoB 27-hydroxylase LPL Oxidation E FC CE E ABCG1 IDL CD36 SR-A LDL ACAT VLDL Bile Cholesterol pool CETP PL TP Intestine ABC1 A-1 A-1 LCAT Macrophage FC HL Nascent HDL ACAT HDL CE IBAT
A+ Change in plaque volume 30-mm segment, intent-to-treat population mm3 6 5.1 ± 30.0 p = 0.058 (unadjusted) p = 0.17 (adjusted) 4 1.9 ± 33.1 2 1.2 ± 24.2 Mean change (±SD) 0 -2 -2.5 ± 26.6 -4 Placebo Avasimibe Avasimibe Avasimibe 50 mg (n = 108) 250 mg (n = 98) 750 mg (n = 117) (n=109) Tardif et al Circulation 2004; 110:3372-7
A+ Long-Term Safety of Intravascular Ultrasound Disease progression Coronary change score New lesions 20 0 -0.02 15 p = 0.27* -0.04 10 (mm) (% of patients) -0.06 p = 0.84* p = 0.35 5 -0.08 -0.10 0 Instrumented (IVUS-related arteries) Non-instrumented (Non-IVUS arteries) J Am Coll Cardiol 2005;45:559-564
IVUS assessment - Atherosclerosis regression 20% reduction in plaque burden Baseline Follow-up Plaque volume (mm3): 272.9 EEM volume (mm3): 609.5 Plaque volume (mm3): 197.3 EEM volume (mm3): 445.9
Correlations between changes in plaque, vessel and lumen areas in pts with regression Mean vessel area (mm2) Mean lumen area (mm2) 6 6 n = 227 r = 0.64 p < 0.0001 n = 227 r = 0.20 p = 0.0030 4 4 2 2 0 0 -2 -2 -4 -4 -6 -6 -4 -3.5 -3 -2.5 -2 -1.5 -1 -.5 0 -4 -3.5 -3 -2.5 -2 -1.5 -1 -.5 0 Change in mean plaque area (mm2) Change in mean plaque area (mm2) Tardif et al. Am J Cardiol 2006;98-23-7
IVUS results in patients with angiographic progression vs no progression by QCA in the IVUS-related artery Progression No progression 250 p = 0.0089 p = 0.05 225 226.8 69.9 217.2 72.1 Mean plaque volume (mm3) 200 197.1 73.6 196.0 71.3 175 150 Baseline Follow-up P-value for mean change in plaque volume: 0.0283 Circulation2007;115:1851-7
Prognostic significance of angiographic progression of coronary atherosclerosis Any coronary event ( n = 112) Death or MI (n = 40) 1.0 1.0 Non progressors Non progressors 0.75 0.75 Proportion event free Proportion event free p < 0.001 p < 0.001 Progressors 0.50 0.50 Progressors (N = 260) (N = 137) (N = 0) (N = 0) (N = 309) (N = 192) (N = 5) (N = 1) 0.25 0.25 0 20 40 60 80 0 20 40 60 80 Months Months Circulation 1993; 87: 1067-75
Canadian Atherosclerosis Imaging NetworkClinical Translation and Practice • Correlation of coronary and carotid atherosclerosis and their changes over time and links with clinical outcomes • 2000 patients undergoing coronary angiography, IVUS (with virtual histology) and carotid ultrasound (IMT and plaques) at baseline and 24 months • 5-year follow-up for cardio/cerebrovascular events • NIRS, PET/CT, MRI and microvascular substudies • Genomic (including miRNAs) and biomarker biobanks • Proteomic and metabolomic analyses • Application of this knowledge and framework in clinical trials of novel anti-atherosclerotic agents
Beyond statin-induced LDL-C reduction • CETP inhibitors • HDL infusions/mimetics • 5-LO/FLAP inhibitors • PLA2 inhibitors • Serpins • Heart rate reduction? Tardif JC, Heinonen T. Nature Clin Pract CV Med 2006;3:366-7
INHIBITION OF ATHEROSCLEROSIS BY HDL HDL INHIBITS ADHESION MOLECULE EXPRESSION Monocyte HDL INHIBITS MCP-1 EXPRESSION LDL Adhesion Molecule MCP-1 LDL HDL INHIBITS OXIDATION OF LDL Cytokines MODIFIED LDL Foam Cell Macrophage HDL PROMOTES CHOLESTEROL EFFLUX
Effects of rApo-A1 Milano on coronary atherosclerosis Change in atheroma volume Change in % atheroma volume 0 1 -4 0.14 ± 3.09 -2.9 ± 23.3 0 -8 mm3 % -12 -0.73 ± 2.75 -1 -12.6 ± 15.3 -1.06 ± 3.17 -14.1 ± 39.5 -16 -15.1 ± 50.6 -1.29 ± 3.48 p = 0.97 p = 0.02 p = 0.007 p < 0.001 p = 0.03 p = 0.45 p = 0.02 -20 -2 Placebo (n = 11) 15 mg/kg (n = 21) 45 mg/kg (n = 15) Combined (n = 36) Placebo (n = 11) 15 mg/kg (n = 21) 45 mg/kg (n = 15) Combined (n = 36) ETC-216 ETC-216 JAMA 2003; 290:2292-2300
The ERASE trial Change in atheroma volume on IVUS Median percent change Median nominalchange 0 0 -0.5 • Plaque volume at baseline: 146.0 mm3 for CSL-111, 151.4 mm3 for placebo • Interval between IVUS examinations : 43 ± 6 days in both groups -1 p=NS p=NS -1 -2.33 -2 -1.62 -1.5 P=0.04 p = 0.07 % mm3 -2 -3 -2.5 -4 -3 -3.41 -5.34 -5 -3.5 p < 0.0001 p < 0.0001 -4 -6 CSL-111 (n = 89) Placebo (n = 47) CSL-111 (n = 89) Placebo (n = 47) Tardif et al. JAMA2007;297:1675-82
The ERASE trial Changes in plaque characterization indexes Arc index Inner perimeter index 0.02 0.02 0.0137 0.0128 0.01 0.01 Least square means Least square means 0 0 -0.0083 -0.0097 -0.01 -0.01 p = 0.01 p = 0.01 -0.02 -0.02 CSL-111 Placebo CSL-111 Placebo Tardif et al. JAMA2007;297:1675-82
The ERASE trial Changes in coronary score on QCA 0 There was a significant interaction between study treatment and baseline coronary score (p = 0.03) -0.02 CSL-111 40 mg/kg Least square means (mm) -0.04 p = 0.03 -0.06 Placebo -0.08 1.76 mm 1st quartile 2.00 mm Median 2.26 mm 3rd quartile Coronary score at baseline JAMA2007;297:1675-82
Lipoprotein metabolism LDL receptor Liver B C-II ACAT MTP LPL C-II FC CE B B ApoB 27-hydroxylase LPL Oxidation E FC CE E ABCG1 IDL CD36 SR-A LDL ACAT VLDL Bile Cholesterol pool CETP PL TP Intestine ABC1 A-1 A-1 LCAT Macrophage FC HL Nascent HDL ACAT HDL CE IBAT
ILLUSTRATE – Primary endpoint Change in Percent Atheroma Volume 0,35 p = 0.72† 0,3 0,25 Changein percent atheroma volume 0,19 0,2 0,15 0,12 0,1 0,05 0 Atorvastatinmonotherapy Torcetrapib-atorvastatin *LS Mean change †p value from ANCOVA Nissen, Tardif, et al. N Engl J Med 2007; 356:1304-16
ILLUMINATE - Primary Endpoint Time to First MCVE*: Kaplan-Meier Plot Hazard Ratio 1.25 100 P=0.001 98 Event Free (%) 96 94 Atorvastatin (A) events = 373 Torcetrapib/Atorvastatin (T/A) events = 464 92 90 0 90 180 270 360 450 540 630 720 810 Days from Randomization *Major cardiovascular event: CHD death, non-fatal MI, stroke or hospitalization for unstable angina NEJM 2007;357:2109-2122
Post-hoc Exploratory Analyses in the Torcetrapib/Atorvastatin Group Hazard ratios for CHD Death or Non-Fatal MI by quintile of on-trial HDL-C (referent group is HDL-C < 60 mg/dL stratum) 1.00 1.0 0.8 0.67 *P<0.05 * 0.57 0.6 * * CHD Death or Non-Fatal MI (Hazard Ratio) 0.47 0.43 0.4 0.2 0 <60 60-70 71-80 81-93 >93 Quintiles of HDL-C (mg/dL) at Month 3 Cox proportional hazard model adjusted for age, gender and baseline HDL-C. Excludes 265 patients with missing month 3 HDL-C. Preliminary analysis initiated and authorised by P Barter and conducted by Pfizer
Lack of Effect of Dalcetrapib vs Torcetrapib on Aldosterone Secretion
The dal-HEARTProgram tests a novel hypothesis: enhancing HDL efficacy through CETP modulation treats the underlying disease of atherosclerosis and will attenuate CV risk The dal-HEART Programdalcetrapib HDL Evaluation, Atherosclerosis& Reverse cholesterol Transport dal-OUTCOMES1 15,600 patients recently hospitalizedfor ACS To evaluate the effect of dalcetrapib on CVoutcomes RECRUITMENT COMPLETE dal-VESSEL2 450 patients withCHD or CHD riskequivalent To evaluate the effect of dalcetrapib onendothelial function and blood pressure, measured by FMD and ABPM RECRUITMENT COMPLETE dal-PLAQUE3 130 patients withCHD To evaluate the effect of dalcetrapib oninflammation, plaque size and burden, measured by PET/CT and MRI RECRUITMENT COMPLETE dal-PLAQUE-24 900 patients withCAD To evaluate the effect of dalcetrapib onatherosclerotic disease progression, assessed by IVUS and carotid B-mode ultrasound RECRUITING 1Schwartz et al. Am Heart J 2009;158:896-901; 2http://clinicaltrials.gov/ct2/show/NCT00655538 Accessed April 1st 2010;3http://clinicaltrials.gov/ct2/show/NCT00655473 Accessed April 1st 2010; 4http://clinicaltrials.gov/ct2/show/NCT01059682Accessed April 1st 2010 .
Dalcetrapib 600 mg DAL-OUTCOMES Study DesignA double-blind, randomized, placebo-controlled, parallel group, multi-centre study in 15,600 patients recently hospitalized for ACS Double-blind Until 1600 events occur but at least a minimum of2 years Single-blind Placebo Run-in 4-12 Weeks Placebo Visit 1 Visit 2 Visit 3randomization1 : 1 Follow up1st year: every 3 monthsFollowing years: every 4 months
dal-PLAQUE-2: Study Design Objective: to assess the effect of dalcetrapib versus placebo on atherosclerotic disease progression in patients with CAD A double-blind, randomized, placebo-controlled, parallel-group multicenter study in 900 patients with CAD Double-blind dalcetrapib 600 mg Pre-rando phase Screening phase up to 8 weeksBaseline IVUS, QCA and CIMT placebo Background of contemporary evidence-basedtherapy for CAD and CV risk factors Primary endpoints: IVUS and CIMT at 24 monthsOther assessments: CIMT at 6+12 months; QCA at 24 months Randomization 24 months
dal-PLAQUE-2Primary endpoints Co-primary endpoints Nominal change from baseline to study end in coronary percent atheroma volume (PAV) for all anatomically comparable slices in a 30-mm segment of the target coronary artery assessed by IVUS Rate of change from baseline to study end in intima-media thickness (IMT), defined as the per scan average of the far wall MEAN IMT values of the right and left common carotid, carotid bulb and internal carotid arterial segments as assessed by carotid B-mode ultrasound
Aortic valve area during treatment Control * 26 *p<0.05 **p<0.01 ** 25 Treated * 24 23 Aortic valve area (mm2) 22 21 20 19 18 Days 17 0 5 10 15 Stop cholesterol diet + Vit D2 Start ApoA-I mimetic peptide treatment Br J Pharmacol 2008;154:765-773
The dual PPAR agonist aleglitazar and change in HDL-C Placebo 0.05 0.15 0.3 0.6 Pioglitazone p< 0.0001 p< 0.0001 p< 0.0001 p<0.0014 p=0.0312 % Δ BL of HDL - C n 54 53 54 54 57 54
14 Aleglitazar 150 μg Provides Beneficial Effects onCardiovascular Biomarkers hsCRP (mg/dL) PAI-1 (μg/mL) Fibrinogen (mg/dL)
ALECARDIO Study Design 4 weeks Treatment Period at least 2.5 years Run-in Period 2–6 (+ 6) weeks Follow-up Aleglitazar 150 µg Index ACS Event Screened Patients Placebo Standard of care (diabetes and other CV risk factors)
VIA-2291 Decreases ex Vivo Whole Blood LTB4 Production from Baseline through Week 12 ** p < 0.0001 ANCOVA Change from Baseline 160,000.00 140,000.00 Placebo 25mg 50mg 100mg 120,000.00 100,000.00 Mean LTB4 Production [pg/ml] 80,000.00 60,000.00 ** 40,000.00 ** 20,000.00 ** 0.00 -2 0 2 4 6 8 10 12 14 StudyWeeks Error Bars represent 95% CI Tardif et al. Circulation Cardiovasc Imaging 2010;3:298-307
Significant Decrease in hs-CRP in VIA-2291 100 mg Group versus Placebo at 24 Weeks
Change in non-calcified plaque volume and patients with new plaque lesions on serial coronary CT scans in the VIA-2291 groups versus placebo at 24 Weeks Plaque volume (mm3) Pts with new plaques (%) 7 30 5 25 p < 0.01 p < 0.01 3 20 1 15 -1 10 -3 5 -5 0 Placebo All VIA-2291 Placebo All VIA-2291 Tardif et al. Circulation Cardiovasc Imaging 2010;3:298-307
Serp-1 Phase 2a Results: Myocardial Enzymes =statistically significant (p<0.05 vs control) = timing of doses Troponin I: Adjusted Geometric Mean CK-MB: Adjusted Geometric Mean CK-MB (ng/ml) Troponin I (ng/ml) VT VT VT VT VT VT VT Tardif et al. Circulation Cardiovasc Interventions 2010 (in press) Dose-dependent reduction in biomarkers of cardiac damage observed in the first 24 hours
RHR in quintiles 62 bpm 63 - 70 bpm 71 - 76 bpm 77 - 82 bpm ≥ 83 bpm Mortality by resting heart rate Overall mortality CV mortality 1.0 1.0 0.9 0.9 0.8 0.8 0.7 0.7 Cumulative survival 0.6 0.6 0.5 0.5 0 5 10 15 20 0 5 10 15 20 Years after enrolment Years after enrolment Adjusted for age, gender, hypertension, diabetes, smoking, NDCV, ejection fraction, recreational activity, medications including -blockers, plus BMI for CV mortality Diaz A, Bourassa MG, Guertin MC, Tardif JC. Eur Heart J2005; 26: 967-74
Ivabradine prevents endothelial dysfunction associated with dyslipidemia in mice RENAL CEREBRAL 100 60 Wild type Dyslipidemia DL+Ivabradine Wild type Dyslipidemia DL+Ivabradine WT WT 90 50 # 80 # DL DL # # 70 DL + IVA DL + IVA 40 60 ‡ Dilation (% of maximal dilation) Dilation (% of maximal dilation) ‡ 50 30 * * 40 ‡ ‡ 20 30 20 10 10 0 0 0.001 0.01 0.1 1 10 0.0001 0.001 0.01 0.1 1 10 ACh (M) ACh (M) Emax: ‡ P < 0.05 vs. to WT; # P < 0.05 vs. to DL pD2: * P < 0.05 vs. WT and DL Drouin et al. Br J Pharmacol. 2008;154:749-757.
INITIATIVE TED at trough of drug activity Ivabradine vs atenolol E (95% CI) P for non inferiority n Favors ATE Favors IVA IVA 5 mg bid vs ATE 50 mg od at M1 595 286 6.7 (-7.4; 20.8) p < 0.0001 IVA 7.5 mg bid vs ATE 100 mg od at M4 300 286 10.3 (-8.3; 28.8) p < 0.0001 IVA 10 mg bid vs ATE 100 mg od at M4 298 286 15.7 (-2.9; 34.3) p < 0.0001 0 - 35 sec + 35 sec Equivalence interval Tardif JC et al. Eur Heart J2005; 26:2529-36
Ivabradine increases all ETT parameters in patients already receiving beta-blockers 889 stable angina patients, 20 countries Ivabradine+ atenolol P<0.001 60 P<0.001 Placebo + atenolol 50 40 P<0.001 P<0.001 Change in ETT criteria* (s) at 4 months 30 20 10 0 Total exercise duration Time to limiting angina Time to angina onset Time to 1mm ST segment depression *Evaluated at trough of drug activity Tardif JC, et al. Eur Heart J. 2009;30:540-548.
Effect of Ivabradine on hospitalisationfor fatal and non-fatal MI (HR ≥ 70 bpm) % with hospitalisation for fatal and non-fatal MI 8 Hazard ratio = 0.64 (0.49 – 0.84) RR = -36% Placebo 6 P = 0.001 4 2 Ivabradine 0 0 0 0.5 1 1.5 2 Years Lancet Online August 31, 2008.
Primary composite endpoint(CV death or hospital admission for worsening HF) Cumulative frequency (%) 40 HR = 0.82 (0.75–0.90) P < 0.0001 Placebo 18% 30 Ivabradine 20 10 0 0 6 12 18 24 30 Months Swedberg K, et al. Lancet. 2010;online August 29.
Ivabradine Starting dose 7.5 mg bid Run in 2 - 4 weeks Target HR: 55-60 bpm Placebo bid Every 6 months M003 M006 M000 Population Outpatients with stable CAD without LVSD (EF > 40%) or clinical signs of HF, with appropriate CV medication Methods Events: 4.5% per year in the placebo group 1070 primary composite endpoints (cardiovascular death and non fatal MI N = 11 330, mean follow up = 2.5 years; RRR = 18%, α bilateral 5%, power 90%
Canadian Atherosclerosis Imaging Network“Hearts and Minds” • Stems from CIHR’s 2007 consensus conference on imaging • Five-year (2008-2013) 10M$ operating grant from CIHR • Infrastructure grant 25M$ from CFI in June 2009 • Unique network combining in vivo imaging of vessel wall disease, end-organ disease, clinical and pathological endpoints • Enables cross-sectional and longitudinal clinical studies of coronary, carotid and peripheral vascular beds • International resource for studying the natural history of atherosclerosis and novel therapeutic interventions
Canadian Atherosclerosis Imaging Network CAIN – one imaging network for one entire country • Imaging Core Analysis Laboratories (vascular) • IVUS, 3-D US, QCA, MDCT, MRI, PET/CT, SPECT • Imaging Core Analysis Laboratories (end-organ) • Pan-canadian network of 45 partner sites • Data coordinating and image repository center (MHICC) • Genetic, pharmacogenomic and biomarker biobanks • Proteomic and metabolomic analyses • Tissue samples
CAINResearch themes • Vascular biology of atherosclerotic plaque • Vascular imaging technology development and assessment • Translation to clinical research and clinical practice Hearts and Minds
Canadian Atherosclerosis Imaging Network1- Vascular Biology of Atherosclerotic Plaque • Assess natural history of the plaque from 3 time points (MRI): • Plaque initiation, progression and complication • Evaluate inflammation, neovascularization and hemorrhage • Determine the role of stimuli such as Db and hyperlipidemia • Study the genetics of atheroma • Assess the role of hypertension, hemodynamics and the interaction with blood constituents at the site of plaque rupture
Canadian Atherosclerosis Imaging Network2- Vascular Imaging Technology Development and Assessment • Validation of developing technologies through quantitative histological examination of surgical specimens • Includes: • Carotid ultrasound - surface morphology, plaque vulnerability and plaque volume • 18FDG-PET – metabolic activity and inflammation • Ultrasound microbubbles – plaque neovascularity
Canadian Atherosclerosis Imaging Network3-Translation to Clinical Research/Practice • Correlation of coronary and carotid atherosclerosis and their changes over time and links with clinical outcomes • 2000 patients undergoing coronary angiography, IVUS (with virtual histology) and carotid ultrasound (IMT and plaques) at baseline and 24 months • 5-year follow-up for cardio/cerebrovascular events • NIRS, PET/CT, MRI and microvascular substudies • Genomic (including miRNAs) and biomarker biobanks • Proteomic and metabolomic analyses • Application of this knowledge and framework in clinical trials of novel anti-atherosclerotic agents