Cosmic Star Formation Rate from Supernovae: Insights up to z~6
100 likes | 216 Views
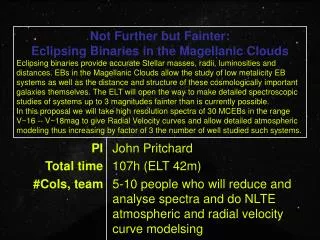
This study utilizes supernovae (SNe) events, both Type Ia and core-collapse, to determine the cosmic star formation rate (SFR) up to redshift z~6, focusing on stars with masses between 3 and 40 solar masses. This method yields more accurate results than traditional UV flux or Hα methods, which are limited to more massive stars (M > 40 M☉). The findings also pave the way for exploring alternative cosmological models. Through an extensive simulation program on the ELT, we aim to refine the understanding of star formation dynamics and related cosmic evolution.

Cosmic Star Formation Rate from Supernovae: Insights up to z~6
E N D
Presentation Transcript
The cosmic star formation rate from SNe Use SNe (Ia and core-collapse) to determine the cosmic SFR up to z~6 as derived from stars with 3 M < M < 40 M This is much more accurate than using UV flux or H methods (which give information on stars with M > 40 M) As a “bonus” these observations will also allow to probe different cosmological models (e.g. alternatives to ) PI Total time #CoIs, team • Roberto Gilmozzi • 90n (ELT 42m) • 10-15 people. Expertise: • photometry • spectroscopy • theoretical interpretation
Why SNe? ~10% ~90% 40 90% of the ionizing flux comes from stars > 40 M
SN rate Star formation Rate Both the Halpha fluxes and the UV fluxes measure only the very upper part of the IMF [>40 M 8% (> 8M)] therefore: • They are NOT good star formation rate indicators because • they require a huge extrapolation to lower masses • the extrapolation depends on the value of Mup which is not well known and may be not a constant quantity in different environment (Bressan et al. 2002) or at different z (Heger et al. 2002)
SNe provide a measurements of the star formation rate which is: 1. Independent of other possible determinations 2. More direct, because the IMF extrapolation is much smaller 3. More reliable because it is based on counting SN explosions rather than relying on identifying and measuring the sources of ionization (if using H-alpha flux) or the sources of UV continum
SN Rate as Tracer of Star Formation Rate a) The rate of core collapse SNe (II & Ib/c) is a direct measurement of the death rate of stars M>8 M (>40 M? Normal II SNe? Normal or Peculiar Ic/b? Collapsars?) b) The rate of type Ia SNe provide the history of star formation of moderate mass stars, 3-8 M c) The evolution of the rate can clarify the nature of the progenitors of type Ia SNe (WD+WD or WD+MS) (Madau, Della Valle & Panagia 1998)
Simulation of a VERY large program (950 hours!) • Simulations of ELT observations yield: • Jx3+Hx3+Kx7: ~ 200 SNe (extrapolating Miralda & Riess 1997) or ~ 350 SNe (MDP 1998) up to z ~ 6 in 50 2’x2’ fields • Light curves, photometric redshifts (galaxy & SN) • Spectroscopy ~50: ~ 50-80 SNe at z < 2.5 • Spectral classification: • SNe Ia visible up to z ~ 5 • Blind below 2400A, K last useful band • SNe II visible up to z ~ 6 • Strong UV emitters (time-dilated UV flash)
ELT Justification: Magnitude of objects (today: z ~ 1) Legacy Value: Evolution of cosmological parameters, evolution of SN progenitors Data Reduction: Challenge: parent galaxy subtraction (eased by working at the diffraction limit, i.e. low surface brightness per pixel)