The 1993 Turnaround
410 likes | 549 Views
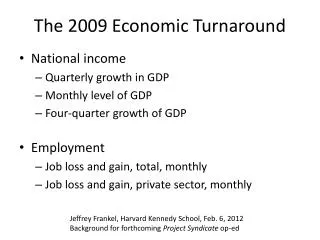
Savings Deficits Links between the Domestic and the International Sectors Econ 102 Winter 2001 Mr. Smitka. The 1993 Turnaround. Structural Balances up, too The Government is Saving. Interest as a share of the budget. Wealth & Consumption. Consumption is up sharply. Investment & Saving.

The 1993 Turnaround
E N D
Presentation Transcript
SavingsDeficitsLinks between the Domestic and the International SectorsEcon 102Winter 2001Mr. Smitka
If everyone is consuming ... • Then where do we get the goods? • (T-G) was negative • (S-I) is negative • So C is high • But I is also high • AS - real GDP - can’t expand overnight • Can all of this happen simultaneously? • What gives?? … inflation?
S-I arithmetic • Y = C + I + G + X - M • C = Y - T - S (“S” is private savings) (“T” taxes net of transfers) • Substituting: Y = Y - T - S + I + G + X - M • Rearranging: 0 = (I + G + X) - (T + S + M) • leakages equal injections • Or: (T-G) + (S-I) + (M-X) = 0
(T-G) + (S-I) + (M-X) = 0 • Govt savings (T-G)plus • Private savings (S-I) plus • Foreign savings (M-X) total to zero • all money goes somewhere! • But these also represent the flows of real goods and services • If the government raises taxes it forces us to cut C and frees resources for G
Case Study: 1980s US • Initial change: Reagonomics • Lower taxes • Increase G (“Star Wars”), don’t cut elsewhere • Let transfers continue their increasing trend (rising health care costs & an aging population) • Despite “voodoo economics” claims during the primaries, this did increase budget deficits • the initial deficits were due to recession, not Reagan & the Democratic Congress that passed his budget • remember “structural” vs “cyclical” deficits
DIGRESSIONFood for thought • Today is different, but partly for cyclical reasons • Will “W” push the “voodoo economics” against which his father campaigned in 1979-80? • Missile defense • Big tax cuts • Hands-off social security, other budget items
So we borrowed a bit ... • Well, $5.6 trillion, mostly under Reagan and Bush Sr. • So what? • Selling lots of bonds drives down prices • That’s the same as driving up interest rates • Or ... (the textbook’s version) • A tax cut stimulates the economy, driving up Y and hence MD and hence “r”
Short-term interest rates (pink)-- as deviation from average --
Now what might happen? • We started out the 1980s in balance(T-G) + (S-I) + (M-X) = 0 0 0 0 • Bit deficits (T-G) threw us out of balance ==> how adjust? • Economists expected “crowding out” (T-G) + (S-I) + (M-X) = 0 -- ++ 0 • Impossible to “buy” growth absent AS shifts • No “flex” anticipated on the intl side
But in fact ... • Real interest rates rose • Attracting foreign capital • And if everyone buys US$ their price rises • We ended up with a very strong dollar
Forex Rates“real” is adjusted for movements against many currencies and for inflation rates
Reflecting ... • Large capital inflows • The US went from being the world’s banker ===> • To the biggest customer of the world’s banks • All during a period of just 8 years
Money flows … and goods? • The strong dollar made imports cheap • US trade moved to big deficits • These deficits however let us keep growing • If used for investment, future growth will let us keep our creditors happy without tightening our belts • If used for consumption….. • Which do you think is the case? (check data!)
US Trade, 1900-2000Historically - until the 1980s - we ran trade surpluses
But others must adjust, too! • If we “want” to run a deficit and borrow from abroad • Others must “want” to run surpluses and lend overseas • In fact, Japan and Germany both suffered from surplus savings • They avoided the paradox of thrift • We could have our cake (I) and eat it too (C)
International Savings (CA) Balances-- Europe and Japan offset the US -- Current Account Balance (Percent of GDP ) 1977- 1980- 1983- 1986- 1989- 1979 1982 1985 1988 1991 1992 1993 1994 -------------------------------------------------------------- U.S. -0.7 0.0 -2.3 -3.2 -1.2 -1.1 -1.6 -2.3 Japan 0.8 0.0 2.8 3.5 1.8 3.2 3.1 2.8 Germany 0.5 -0.5 1.7 4.3 2.2 -1.2 -0.8 -1.1 France 0.8 -1.2 -0.6 -0.2 -0.8 0.3 0.8 0.7 Italy 1.6 -2.2 -0.5 -0.2 -1.7 -2.3 1.2 1.3 U.K. 0.2 1.9 0.7 -1.6 -3.0 -1.7 -1.9 -0.1 Canada -1.9 -0.7 0.1 -2.3 -3.9 -4.0 -4.3 -3.3 k G10 average -0.2 -0.8 0.5 0.5 -0.3 -0.5 0.5 0.8
Swings in Japan were v. large- one source of savings for the US - • Investment plummeted with the transition from high growth (postwar reconstruction, convergence with the US) to “normal” growth c. 1971-73 • But the Japanese were still poor and kept saving • So a potential “paradox of thrift” developed • Keynesian budget deficits bailed them out 1975-81 • Exports to the US bailed them out from 1982-1986 • And a “bubble” during 1987-91 • But slow growth since then
Macro, not micro! • As the previous chart shows, we import everything!! • Aggregate trade is a “macro” issue,not a micro one • Indeed, developing countries’ experience suggests protectionism exacerbates deficits • Intermediate goods imports dominate, and a small “burp” in trade thus kills all production
Freer trade leads to more trade • But it also raises incomes through enhanced long-run productivity growth!! • Remember, tariffs and quotas are taxes, and hurt real incomes while shifting production to sectors where we’re inefficient
Trade deficits • Trade deficits accumulate • But we’ve got lots of trade in lots of sectors • There will be no sudden crisis, but: • a gradual loss in maneuvering room if we must keep real interest rates high to attract capital • lower “I” and slower long-run growth
The End Economics 102 Prof. Smitka Winter 2001