Graphing Quadratic Functions with Examples and Solutions
Learn how to graph quadratic functions step by step with examples and solutions. Identify coefficients, find vertex, plot points, and draw parabolas easily.

Graphing Quadratic Functions with Examples and Solutions
E N D
Presentation Transcript
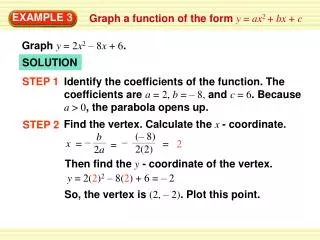
(– 8) 2(2) – – x = = 2 = b 2a EXAMPLE 3 Graph a function of the form y = ax2 + bx + c Graph y = 2x2 – 8x + 6. SOLUTION STEP 1 Identify the coefficients of the function. The coefficients are a = 2, b = – 8, and c = 6. Because a > 0, the parabola opens up. Find the vertex. Calculate the x - coordinate. STEP 2 Then find the y- coordinate of the vertex. y = 2(2)2– 8(2) + 6 = – 2 So, the vertex is (2, – 2). Plot this point.
EXAMPLE 3 Graph a function of the form y = ax2 + bx + c STEP 3 Draw the axis of symmetry x = 2. STEP 4 Identify the y - intercept c, which is 6. Plot the point (0, 6). Then reflect this point in the axis of symmetry to plot another point, (4, 6). Evaluate the function for another value of x, such as x = 1. STEP 5 y = 2(1)2 – 8(1) + 6 = 0 Plot the point (1, 0) and its reflection (3, 0) in the axis of symmetry.
EXAMPLE 3 Graph a function of the form y = ax2 + bx + c Draw a parabola through the plotted points. STEP 6
(– 2) 2(1) b 2a – x = = 1 = y = 12– 2 1 + 1 = – 2 for Example 3 GUIDED PRACTICE Graph the function. Label the vertex and axis of symmetry. 4. y = x2 – 2x – 1 SOLUTION STEP 1 Identify the coefficients of the function. The coefficients are a = 1, b = – 2, and c = – 1. Because a > 0, the parabola opens up. Find the vertex. Calculate the x - coordinate. STEP 2 Then find the y- coordinate of the vertex.
for Example 3 GUIDED PRACTICE So, the vertex is (1, – 2). Plot this point. STEP 3 Draw the axis of symmetry x = 1.
– – – – – x = = = – 6 2 2 3 2 3 2 3 2 3 2 b 2a ( ( ) ) y = 2 6 + + 3 = – 9 So, the vertex is , – 9. Plot this point. for Example 3 GUIDED PRACTICE 5. y = 2x2 + 6x + 3 SOLUTION STEP 1 Identify the coefficients of the function. The coefficients are a = 2, b = 6, and c = 3. Because a > 0, the parabola opens up. Find the vertex. Calculate the x - coordinate. STEP 2 Then find the y- coordinate of the vertex.
Draw the axis of symmetry x = – 3 2 for Example 3 GUIDED PRACTICE STEP 3
6. f (x) = x2 – 5x + 2 – – Identify the coefficients of the function. The coefficients are a = , b = – 5, and c = 2 . Because a > 0, the parabola opens up. – – x = ( – 5) 1 3 15 2 3 2 1 3 b 2a = = ( ) 2 for Example 3 GUIDED PRACTICE SOLUTION STEP 1 Find the vertex. Calculate the x - coordinate. STEP 2 Then find the y- coordinate of the vertex.
– 76 2 – 76 2 So, the vertex is ,. Plot this point. 152 152 152 Draw the axis of symmetry x = – 3 2 15 2 for Example 3 GUIDED PRACTICE ( ( ) ) y = – 5 + 2 = STEP 3