Download
1 / 11
120 likes | 458 Views
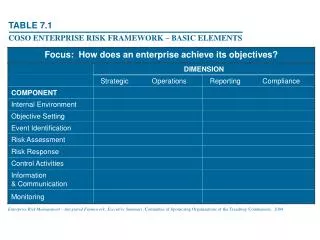
TABLE 7.1 COSO ENTERPRISE RISK FRAMEWORK – BASIC ELEMENTS. Enterprise Risk Management – Integrated Framework: Executive Summary , Committee of Sponsoring Organizations of the Treadway Commission, 2004. TABLE 7.2 IDENTIFICATION OF BUSINESS RISKS. FIGURE 7.1

E N D
TABLE 7.1 COSO ENTERPRISE RISK FRAMEWORK – BASIC ELEMENTS Enterprise Risk Management – Integrated Framework: Executive Summary, Committee of Sponsoring Organizations of the Treadway Commission, 2004
TABLE 7.2 IDENTIFICATION OF BUSINESS RISKS
FIGURE 7.1 ETHICS RISK AND OPPORTUNITY IDENTIFICATION AND ASSESSMENT • PHASE 3 • Reports by • Stakeholder group • Product or service • Corporate objective • Hypernorm value • Reputation driver PHASE 2 Compare activities to expectations to identify ethics risks and opportunities PHASE 1 Develop a projected, ranked understanding of stakeholder interests/expectations Reputation Driver: Trustworthiness, credibility, reliability, responsibility Identify Confirmation Hypernorm: Honesty, fairness, compassion, integrity, predictability, responsibility Rank: Urgency, power, legitimacy Dynamic analysis Performance: Inputs, outputs, quality
FIGURE 7.2 DIAGNOSTIC TYPOLOGY OF ORGANIZATIONAL STAKEHOLDERS STAKEHOLDER’S POTENTIAL FOR THREAT High Low Type 4 Mixed Blessing Type 1 Supportive High Strategy Collaborate Strategy Involve STAKEHOLDER’S POTENTIAL FOR COOPERATION Type3 Nonsupportive Type 2 Marginal Low Strategy Defend Strategy Monitor SOURCE: G. Savage et al, “Strategies for assessing and managing organizational shareholders”, The Executive, Vol. 5, no. 2, May 1991, 65.
TABLE 7.3 GLOBAL REPORTING INITIATIVE SUSTAINABILITY REPORTING GUIDELINES STANDARD DISCLOSURE FRAMEWORK – G3 VERSION [DRAFT] Source: Sustainability Reporting Guidelines [Draft], G3 version, Global Reporting Initiative, January 2006
TABLE 7.5 EMPLOYEE RIGHTS THEMES IN NORTH AMERICA
FIGURE 7.3 THE FRAUD TRIANGLE Motive Opportunity Rationalization Source: D.L. Crumbley et al, 2005, p. 3-131
FIGURE 7.4 MASLOW’S HIERARCHY OF NEEDS Self-actualization, Fulfillment Ego Esteem, Respect Love, Affinity Social Safety Physical Physiological
TABLE 7.6 HEATH’S SEVEN RATIONALIZATIONS OF UNETHICAL ACTIONS • Denial of responsibility. • Denial of injury. • Denial of the victim. • Condemnation of the condemners. • Appeal to higher loyalties. • Everyone else is doing it. • Entitlement. Source: “7 Neutralization/Rationalization Techniques”, a speech by Joseph Heath at the Centre for Ethics at the University of Toronto, April 9, 2007
FIGURE 7.5 PHASES OF A CRISIS Unanticipated Crisis Anticipated Crisis CostTo Organization ContinuingReputationalImpact Post-CrisisState Reached ControlBegins Time Controlled Phases Pre-crisis ReputationRestoration Uncontrolled
TABLE 7.7 HOW TO INCORPORATE ETHICS INTO CRISIS MANAGEMENT