Download
1 / 30
300 likes | 430 Views
AGEC/FNR 406 LECTURE 19. Acid Rain. Name derives from a chemical reaction between SO 2 (sulfur dioxide) NO 2 (nitrogen dioxide) and H 2 O (water). Reaction leads to. Creation of sulfuric and nitric acid,

E N D
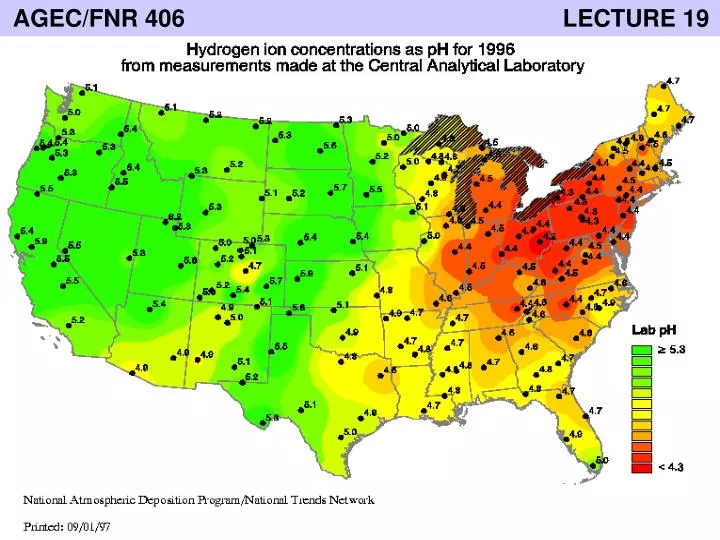
AGEC/FNR 406 LECTURE 19
Acid Rain Name derives from a chemical reaction between SO2 (sulfur dioxide) NO2 (nitrogen dioxide)andH2O (water)
Reaction leads to... • Creation of sulfuric and nitric acid, • which fall in the form of acidified rain(or snow or sleet).There are actually two forms of acid deposition: • wet deposition • dry deposition • http://www.epa.gov/airtrends/sulfur.html
Electric power generation that relies on burning fossil fuels like coal: • 2/3 of sulfur dioxide emissions • 1/4 of nitrogen oxides emissions http://www.epa.gov/acidrain/what/index.html
Sources • Both natural and anthropogenic sources(90-95% man-made) • Rain is naturally a bit acidic (pH 5.6) due to atmospheric CO2. • U.S. - Electricity generating plants burning high-sulfur content coal and oil • Canada - Ore smelters • Europe - Electricity
http://www.state.in.us/idem/programs/air/emissionreporting/emissionsdata/http://www.state.in.us/idem/programs/air/emissionreporting/emissionsdata/
North America (1998 data) SO2 US: 17.7 million MT (67% from elec utilities) Canada: 2.7million MT (74% from industry) About 4 million MT of SO2 crosses the border annually.
Acid Deposition (Acid Rain) • Regional Pollutant • Effects felt over a broad geographic area. • Location important: Effects felt downwind of source. • Transboundarypollutant • Emitted in one country and transported across a national border to another country. • U.S. sulfur dioxide emissions responsible for 50-75% of acid deposition over most of eastern Canada. • Canada sulfur dioxide emissions responsible for < 5% of acid deposition in the U.S.
Acid rain impacts 1. Aquatic systems (-) 2. Forests (-) 3. Human health (-) 4. Visibility (-) 5. Agriculture (- /+) 6. Building materials (-)
Critical load The total amount of acid deposition that can be received without damage to an ecosystem. Aquatic plants: pH 7.0-9.2 Freshwater shrimp: pH 6 Bottom-dwelling bacteria: pH 5.5 Fish: pH 4.5 Frogs and insects: pH 4.5
Example: NY state lakes Acidification of lakes and streams reduces value of recreational fishing.
Example continued TravelCost $250 Damage = Loss in consumer surplus. P = 250 -5Q $200 P = 200 -5Q 0 0 50 40 Number of visits
Damage and cost assessment Main issues: 1. Market and non-market effects 2. Chemical synergies + metals 3. “Common metric” problem Measurement and quantification of MAC is difficult due to interdependencies. Who benefits? Who should pay?
Actual policy in U.S. 1970-1990- uncertainty prevailed - Reagan administration stalled - EPA regulations focused on local effects which may have exacerbated problem 1990-present- Clean Air Act: marketable permits (1990) - NOXexcluded, 1-1 trading ignores location - SO2 falling but NO2 increasing
Why so long? Political concern regarding job lossesin coal-producing states (IN, IL, MI, OH) Local losses in high-sulfur coal stateswould be balanced by gains in low-sulfurcoal statesCosts of electricity would rise
Marketable Permits: Allowances • Emission standard set and number of permits determined. • Permits issued to polluters based on some allocation system. • Polluters allowed to trade permits. • Market should develop…
Why does trading work? • 1. If firm can cleanup at a price lower than the permit price, it will. • Low MAC firms sell permits • 2. If cleanup is costly then a firm will choose to buy a permit • High MAC firms buy permits • 3. Anyone who wants to can buy a permit.
Acid Rain Program • Allowances allocated each year – one allowance allows utility/source to emit one ton of SO2. • Phase I: Allowances to 110 highest emitting coal-fired power plants (>100 megawatts) • Phase II: All power plants > 25 megawatts must participate. • Sources that exceed their allowances fined ($2,000/ton) and allowances reduced by the excess the next year. • Compliance has been 100% thus far.
EPA Allowance Auctions • Allowances offered at auctions • 1998-99 Spot auction: 150,000 allowances. • 1998-99 Advance auction: 125,000 allowances • 2000 and after: 125,000 for each auction. • These allowances can be bought and sold once purchased. • Allowances sold starting with the highest bid and continuing until allowances sold or bids exhausted.
Experience with trading • # of permits traded has been rising • market clearing price has been increasing http://www.epa.gov/airmarkt/trading/auction.html
Have SO2 emission levels fallen? Eastern Canada (regulation) by 1999 emissions had fallen 58% from 1980 levelUnited States (regulation + trading) by late 90s emission had fallen 39% from 1970 level
SO2 Emissions under the Acid Rain Program Sources have started using banked allowances.
SO2 Emissions and the Allowance Bank Banked allowances
Comparison of Ambient Sulfur Dioxide Concentrations in the Eastern United States from CASTNet Monitoring Data