
Analysis of Tumor Cell Density Correlation in Cancer Research Studies
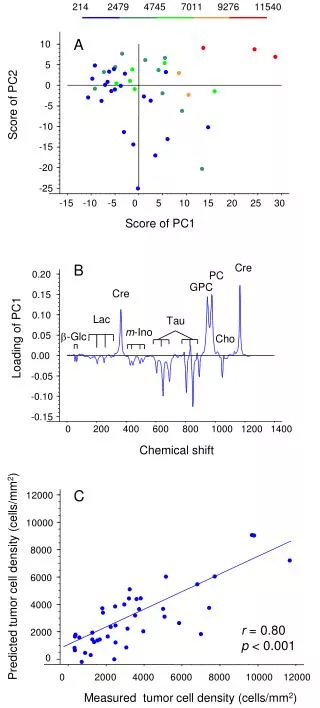
This study investigates the correlation between predicted and measured tumor cell density in various samples. Utilizing principal component analysis (PCA), we evaluate the scores of principal components associated with chemical shifts and other metabolic markers. The findings show a strong positive correlation (r = 0.80, p < 0.001) between predicted tumor cell density and measured values, indicating the reliability of predictive models in estimating tumor metrics. This research contributes valuable insights into cancer biology and the assessment of tumor aggressiveness.

Analysis of Tumor Cell Density Correlation in Cancer Research Studies
E N D
Presentation Transcript
214 2479 4745 7011 9276 11540 -15 -10 -5 0 5 10 15 20 25 30 0.20 0.15 Lac 0.10 m-Ino 0.05 0.00 -0.05 -0.10 -0.15 12000 10000 8000 6000 4000 2000 0 0 2000 4000 6000 8000 10000 12000 A 10 ● ● ● ● ● ● ● 5 ● ● ● ● ● ● ● ● ● ● ● ● ● ● ● 0 ● ● ● ● ● ● ● ● ● ● Score of PC2 ● ● -5 ● -10 ● ● ● ● -15 ● -20 ● ● -25 Score of PC1 B Cre PC GPC Cre Tau -Glc Loading of PC1 Cho 0 200 400 600 800 1000 1200 1400 Chemical shift C ● ● ● Predicted tumor cell density (cells/mm2) ● ● ● ● ● ● ● ● ● ● ● ● ● ● ● ● ● r = 0.80 p < 0.001 ● ● ● ● ● ● ● ● ● ● ● ● ● ● ● ● ● ● ● ● ● ● Measured tumor cell density (cells/mm2)