Download
1 / 33
330 likes | 430 Views
Radio and Far Infrared Observations of AGB Mass Loss. Arancha Castro-Carrizo ccarrizo@iram.fr. Introduction. Introduction What about the presence of asymmetries in the AGB mass loss?. …before 2003. PDBI CN(2-1). IRC+10216. CFHT V-BAND. DUST. 15” = 400 yr D = 80 pc.

E N D
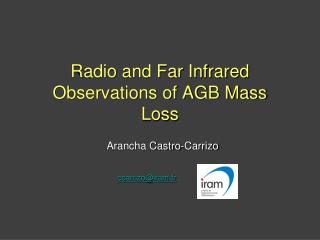
Radio and Far Infrared Observations of AGB Mass Loss Arancha Castro-Carrizo ccarrizo@iram.fr
Introduction Introduction What about the presence of asymmetries in the AGB mass loss? …before 2003
PDBI CN(2-1) IRC+10216 CFHTV-BAND DUST 15” = 400 yr D = 80 pc Mauron & Huggins (1999) Guélin et al. (2000) Structure in AGB CSEs Introduction • Rings mainly in the optical
Structure in AGB CSEs Introduction • Rings mainly in the optical IRC+10011 VLBA • Masers of OH, SiO, and H2O (with VLBI); spots close to the star denoting anisotropy in the innermost regions, incomplete clumpy shells, predominantly in expansion, with some other complex motions SiO v=1 J=1-0 Desmurs et al 2000
Weigelt et al. (2002) Structure in AGB CSEs Introduction • Rings mainly in the optical • Masers of OH, SiO, and H2O (with VLBI); spots close to the star denoting anisotropy in the innermost regions, incomplete clumpy shells, predominantly in expansion, with some other complex motions • NIR; monitoring inner dust shell emission
Y CVn 90μm 15”x20” 160μm 30”x90” Izumiura et al 1996 FIR Imaging Introduction • IRAS imaging (survey by Young et al 1993, Hawkins 1990, Waters et al 1994, Izumiura et al 1997) • ISO/ISOPHOT imaging(Izumiura et al 1996)
CO atlas of CSEs by Neri et al 1998 • A few peculiar AGB: • TT Cyg, U Cam – Olofsson et al 2000 & Lindqvist et al 1999 • CWLeo – Fong et al 2003 IRAM PdB+PV Introd molecular gas Introduction Mapping molecular gas
TT CygOlofsson et al 2000 U CamLindqvist et al 1999 • CO atlas of CSEs by Neri et al 1998 • A few peculiar AGB: • TT Cyg, U Cam – Olofsson et al 2000 & Lindqvist et al 1999 • CWLeo – Fong et al 2003 IRAM PdB Introd molecular gas Introduction Mapping molecular gas
CO atlas of CSEs by Neri et al 1998 After background removal • A few peculiar AGB: • TT Cyg, U Cam – Olofsson et al 2000 & Lindqvist et al 1999 • CWLeo – Fong et al 2003 CW Leo 12CO J=1-0 Fong et al 2003 BIMA+NRAO 12m Introd molecular gas Introduction Mapping molecular gas
From FIR to cm from 2003 from FIR to radio What about the presence of asymmetries in the AGB mass loss? …from 2003
FIR from 2003 FIR from 2003 Imaging in the Far Infrared • ISOPHOT imaging of AGB stars(IRC-10529 by Hashimoto & Izumiura 2004, Mchunu, Speck & Meixner 2005) • MLHES program by Akari (see poster by Ueta et al) • MIRIAD project to image with SST MIPS (70,160μm) dust around AGB
FIR, R Hya FIR from 2003 R Hya FIR imaging Coverage of the observation runs Ueta et al. 2006
100” 100” FIR, R Hya FIR from 2003 R HyaFIR data & model Spitzer MIPS 70μm Wareing et al. 2006 Ueta et al. 2006 Gas density after 40 000 yr
VLBA Boboltz & Diamond 2005 Masers Masers from 2003 Masers • SiO maser in AGB CSEs, monitoring; Cotton et al 2004, 2006, Diamond & Kemball 2003, Boboltz & Diamond 2005 • Emission is confined to a ring of ~ 2xR2.2μm • Short lifetime for individual spots • Diameter of the SiO ring show variations of 3-14% • The degree of linear polarization also changes • Possibly rotation for the snapshots of some stars, IK Tau, o Ceti, etc
Masers Masers from 2003 Masers • 28SiO & 29SiO maser emission;discussion on the SiO maser pumping mechanism, radiative or collisional(Soria-Ruiz et al 2004-2007) VLBA IRC+10011 • Compact emission distributed in ring-like structures • Different layers for the different SiO masers • H2O IR line overlapping plays a role in the amplification of the pumping in O-rich AGB CSEs (TX Cam, R Leo)
21cm HI emission HI from 2003 21cm HI emission Observations with NRT by Le Bertre & Gerard 2004-2006 (with beam 4’x22’) and with VLA by Matthews & Reid 2007 (with resolutions ~ 100”) • Asymmetries in EP Aqr, X Her, likely interaction with the ISM for Y CVn (NRT) • Axisymmetric RS Cnc and weak shell-like structure in R Cas (VLA) RS Cnc R Cas
Molecular lines Mapping molecular gas …from 2003
CN 2-1 J=5/2-3/2 F=7/2-5/2 @ 226.875 GHz CN 2-1 J=3/2-1/2 F=5/2-3/2 @ 226.660 GHz U Cam Molecular emission from 2003 U Cam IRAM PdB+PV Lindqvist et al. (in prep) 12CO J=2-1 @ 230 GHz
Pi.01 Gru Molecular emission from 2003 1Gru Chiu et al 200612CO J=2-1 SMA
X Her & V Hya Molecular emission from 2003 X HerCO 1-0 Nakashima 2005 BIMA V HyaCO 3-2 Hirano et al 2004 SMA
IRAM Survey of 12CO Molecular emission from 2003 Aims: Determination of the mass-loss history, geometry, kinematics, clumpiness, photodissociation radius, ejections of “post-AGB” winds, etc 46 stars, selected to represent the diversity of AGB stars (evolutionary status, initial mass, chemical class, variability types, peculiar CO profiles) and few early post-AGB stars
IRAM Survey of 12CO Molecular emission from 2003 A Castro-Carrizo, R Neri, JM Winters, R Lucas & M Grewing (IRAM) V Bujarrabal, G Quintana-Lacaci, J Alcolea (OAN) H Olofsson, FL Schöier, M Lindqvist (SO,OSO)
Observational stratregy IRAM Survey of 12CO Strategy: map 12CO J=2-1 & 1-0 • PdB inteferometric observations Track-sharing 2 sources = 2 tracks • PV telescope data for short-spacing OTF maps, raster mapping, [0,0]
R Cas IRAM Survey of 12CO R Cassiopeia CO J=1-0 IRAM PdB+PV Radial brightness increases Mass loss fluctuations
Axis-symmetric hour-glass structure X Her IRAM Survey of 12CO X Herculis IRAM PdB+PV CO J=1-0
TX Cam IRAM Survey of 12CO TX Camelopardalis IRAM PdB+PV CO J=2-1 & CO J=1-0 Pronounced halo Non-centered hook-like structure
Axisymmetric X-shaped remnant V Hya IRAM Survey of 12CO V Hydrae IRAM PdB+PV CO J=1-0 data just from 1 track
CO J=2-1 CO J=1-0 IRC+50049 IRAM Survey of 12CO IRC +50049 IRAM PdB+PV CO J=1-0
Overall spherical Axisymmetric inner structure Velocity gradient RX Boo IRAM Survey of 12CO RX Bootis CO J=1-0 IRAM PdB+PV
CO J=2-1 CO J=1-0 Chi Cyg Survey of CO in CSEs χ Cygni IRAM PdB+PV
uv plane (Schöier, Olofsson & Lindqvist et al) • image plane (Bujarrabal, Quintana-Lacaci, Alcolea et al) Modeling IRAM Survey of 12CO • Modeling with radiative transfer LVG codes, including higher-J CO lines from APEX
Mdot fluctuations IRAM Survey of 12CO Schöier et al (in prep.)
Mass-loss rates are not constant in time (arc/rings), and these variations are diverse • AGB CSEs show anisotropies in the different mass-loss phases, collimated outflows also in the AGB, clumpiness, etc Conclusions Conclusions Does asymmetry already start on the AGB? Yes • Some AGB CSEs present at large scale (FIR, HI) asymmetries due to interaction with ISM