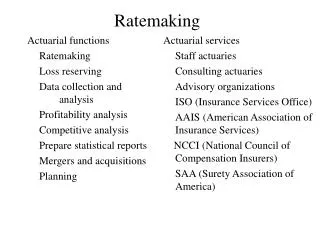
UK versus US Auto Ratemaking
370 likes | 466 Views
UK versus US Auto Ratemaking. Panelists: Mike Brockman Kevin Kelso Moderator: Karen Schmitt. A few interesting features of the UK market. No rate regulation Dynamic market Fewer actuaries Large percent of sales via direct channels Little industry-wide data available

UK versus US Auto Ratemaking
E N D
Presentation Transcript
UK versus US Auto Ratemaking Panelists: Mike Brockman Kevin Kelso Moderator: Karen Schmitt
A few interesting features of the UK market • No rate regulation • Dynamic market • Fewer actuaries • Large percent of sales via direct channels • Little industry-wide data available • Different product design • Unlimited liability
The US Market - A UK View Price Regulation and Tied Agencies • greatly affects ratemaking practice • less freedom to change prices frequently • less freedom to introduce new risk variables • arguably less competitive pressures • net result more profit
The US Market - A UK View Price Regulation and Tied Agencies • rating plans designed around regulation • tiering systems blurs risk variable differences and interationships • less active statistical analysis • transparency of rates and information means more “followers”
The US Market - A UK View Cover and limited liability • rating on vehicle means risk less well defined and less predictable • fixed policy limits means less need for reinsurance
The US Market - A UK View Under which approach is the consumer better served? • Balance between good value for consumers and solvency and profits to insurers • US system probably gets balance right • UK system consumers get too good a deal - profits margins low and solvency risk high
The UK Market -- a US View Curious Mix of Quaint and Modern • Change rates willy-nilly • Catching up on litigation -- moving to contingency-based legal fees • External data not available • Centralized MVRs • Credit scores • Loss histories
Per Capita Ethanol Consumption Litres per year
Alcohol-related Auto Fatalities Deaths per 100,000 population
Access to data How has access to data shaped ratemaking approaches in each market? Data sources: • ISO / other statistical databases • ABI (UK) • motor vehicle records • credit information
Access to competitor information Competitor information including rates is freely available in the US market due to the rate regulation. How has access to competitor information shaped ratemaking in each market?
Regulation The UK has no price regulation at all. In the US, regulatory approval play a large role in how an insurer goes about setting rates. What is the lost/gain to the US market under current processes?
Distribution Direct writers made it big in the UK market much earlier than in the US. What is the outlook in each market for direct writers now that Internet sales are in development?
Automobile Ratemaking in the US and UK PL-35 CAS Ratemaking Seminar 2001 Las Vegas Panelists: Mike Brockman and Kevin Kelso
Motor Vehicle Records, Loss History Reports and Credit Data • external data bases are available • vehicle details accessed from registration number • addresses from postcode • socio demographic from postcode • industry pooled databases • CUE claims underwriting exchange • Credit history can purchased • used in pricing • used for risk selection • correlations need care
Liability v Physical Damage Loss Mix UK Differences • liability depends on coverage bought • personal injury proportions • 25%-35% comprehensive • 50% - 65% TPFT • frequency and severity • comp 1% frequency $13,000 severity • tpft 1.3% frequency $14,500 severity • risk factors • more frequency driven than severity • large claim propensity varies by cell • little territorial differences in severity
Unlimited v Limited liability • unlimited liability coverage compulsory • largest claim to date $19 million • cost of future care a big issue • large claim identification important • large claim propensity analyses • low level excess of loss reinsurance
Vehicle v Driver Cover • historically vehicle was covered • evolved to driver based coverage • can drive other vehicles third party only • conceptually easier to price • only, named, any driver covers • important relationships between these • deductibles depend on driver
Uninsured Motorist Cover • TP cover mandatory • uninsured losses not a big problem • Motor Insurers’ Bureau pays losses • MIB financed through levies • current levies about 2% of premium income
Age of Access to Driving • legal minimum age is 17 • must pass test to gain full licence • affordability not a serious problem - yet • large supply of insurers quoting • most buy TPFT cover, old cars • no claims bonus transferable between covers
Regulatory Differences • no rate filing, rates changed frequently • wide range of rating factors • demand pricing becoming more common • pricing based on price sensitiveness • some discomfort, unjustified in my opinion • more sophisticated way of doing what’s always been done • new business and renewal pricing • no reason to be the same • knowledge of customer differs • expenses differ, both admin and overhead issues • managing the annual premium movement • quotation engine constraints
Demand Pricing • rating builds in propensity to by at a price • insurer can more effectively control margins • demand propensity acts as safety net • exploits market anomolies with competitive premiums • a win win strategy
Optimal Pricing Strategy Risk Premium Model Expenses Renewal Model PRICE Optimisation Algorithm Most Loyal Most Profitable MOST VALUABLE
Territory Rating • no common practice • territory groupings • range from 8 to possibly 50 • some use demographic information • relativities range from 1 to 5 • need to understand correlations between risk factors • Underwriting restrictions by territory
Multi v Single Variable Methodology • Multivariate analyses only truly way to understand risk relationships • Very important with correlated variables • Modern rating plans have more factors • technology changing to allow more sophisticated analyses • Must explain concepts to regulators
Rating Tiers • Not a concept in UK • No distinction between risk factors • However can have specialist products • to brand segments • to offer different commissions • to limit cover i.e different deductibles • to have different risk relativities • to be subject to tight underwriting rules
Motor Theft Claim Frequency Trends Using Insurer Area Classification
Motor Theft Claim Frequency Trends Using RMS Household Theft Hazard Function
Motor Theft Claim Frequency Trends Theft Hazard Function Allowing for Correlation
Competitive Analysis • brokers quotation systems are generally available as competitive tools but …. • brokers have special deals • direct response rates not included • best measure is demand for products • conversion and renewal analyses • allows for brand and distribution channel
Interaction between underwriting, pricing and marketing • risk selection common in UK, although practice varies • some quote all risks but high rates for undesirable segments • some introduce strict terms • some do not quote • some refer to non standard insurer • direct response may target strategically • perception of good and bad varies so still good supply • very important to understand interaction in direct response
Distribution/ Sources of Business • tied agents relatively small part of market • 48% independent brokers • 7% other intermediary e.g banks and building societies • 34% direct response • 7% company agents • 4% other • source of business and distribition channel is very predictive • classification factors only proxies • life style factors help • buying behaviour provides customer information • information available differs by channel