Download
1 / 38
390 likes | 556 Views
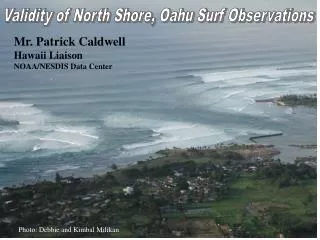
Validity of North Shore, Oahu Surf Observations. Mr. Patrick Caldwell Hawaii Liaison NOAA/NESDIS Data Center. Photo: Debbie and Kimbal Milikan. Talk Outline. Goddard-Caldwell Data Set. Analysis and Results. Surf Climatology. User Community. Motivation. - Recreation Commercial Ventures

E N D
Validity of North Shore, Oahu Surf Observations Mr. Patrick Caldwell Hawaii Liaison NOAA/NESDIS Data Center Photo: Debbie and Kimbal Milikan
Talk Outline Goddard-Caldwell Data Set Analysis and Results Surf Climatology
User Community Motivation • - Recreation • Commercial Ventures • Engineering • Transportation • Research • Gov’t Coastal Zone • Management • Litigation • - Surf forecast validation Surf Information: Planning and Protecting Life and Property • Goddard-Caldwell surf database • the most requested dataset from • NOAA Hawaii Data Office Photo: Patrick Holzman, Location: Kamalino Drive, Kailua, Oahu, November 2003
Regional Data Added to the NOAA Posterity Archive Number Of Unique Acquisitions (NODC Accessions) *since 1998 Updated Dec 28, 2005
Who Provided Data? Number Of Unique Acquisitions Since 1998 Updated Dec 28, 2005
Updated Dec 28, 2005 Regional Data Services Data Category Number of Unique Requests 265 requests since 10/2001 These are hands-on requests, not automatic transfers from FTP/WWW.
Services: To Where? Hands-on since 10/2001 Updated Dec 28, 2005
Services: What Parameters? Hands-on since 10/2001 Updated Dec 28, 2005
Primary Surf Data Sources: Buoys and Surf Observations Buoys Pros: - explicit measurements - gives statistical distribution (energy spectrum) - around the clock Cons: - not surf, offshore waves - technical break downs - limited length - buoy 51001 since 1981 - buoys 51002-4 since 1984 - Kailua (8/00), Waimea (12/01) Dept. of Oceanography University of Hawaii Kailua Buoy
Primary Surf Data Sources Surf Observations Pros: - explicit surf heights - inherent knowledge base - longest, most continuous (daily data since 8/1968) - more locations Cons: - subjectivity - only daylight - limited statistical distribution of each report (no spectrum)
Observations in history/science Hawaiian language: 135 words: moods of sea and surf 149 words: wind 87 words: rain 27 words: clouds Harold Kent, “Treasury of Hawaiian Words in 101 Categories”
Beaufort Wind Scale Developed in 1805 by Sir Francis Beaufort of England Visual observations to estimate wind speeds at sea on a scale of 1-12 Other Observations used In science: rogue waves
Observational Network Goddard-Caldwell Dataset Waimea buoy North Shore Observations, 1968-present Kailua buoy Primary reporting locations
What is in the Goddard-Caldwell Database? • Daily value • - for given range, • upper end of range • - units: Hawaii Scale • - highest report of day • -North Shore special case • - represents location of • highest reported breakers • Regardless of Height Scale • Course resolution • -difficulties to define temporal • variability • -difficulties to define where along • wave front the height refers to • -which reef is being referred to? • -published literature shows tendency • for underestimation of surf heights
Temporal Variability 29 November, 2004 What is the range given in surf reports? (if report given as 10-12 ocn 15, what does that mean?)
Most frequent Average height 29 November, 2004 Significant height (H1/3) Benchmarks (surfers) H1/10 H1/100 Wave height Frequency of Occurrence Rayleigh Wave Distrubtion Surf report: H1/3 to H1/10, ocn H1/100
Spatial Variability Simulating Waves Nearshore (SWAN) Model Incident 2.5 m, 14 second from 315o 20m isobath 315o -Large variations in surf height along a given shoreline -Largest breakers occurs in zones of high refraction - this is where surfers go - this is where reports are made Height (m) Incident 6.5 m, 19 second from 317o
Methodology: buoy-derived, shoaling-estimated surf height: Data: - Daily Surf Observations - Buoy 51001 (1981-2002) - Waimea Buoy (2002) maximum Hb between 7am-5pm (07-22Z for 51001) Following Komar and Gaughan, 1973 Days removed from data: - April - September - strong trades (>22 knots) - dominant period < 12 sec * Conservation of energy flux * Ignores refraction, diffraction, bottom friction, currents, wave-wave interactions, and wind
Temporal Consistency Test Surf Observation minus Buoy-estimated Surf Height Ratio = Difference / Estimated Height Absolute heights unimportant
Error Estimates Magnitude of Error increases with height Average Error ~15%
Wave Climatologies Most cited reference: MOBERLY,R.J., and CHAMBERLAIN,T., 1964. Hawaiian Beach Systems. Honolulu, Hawaii: University of Hawaii, Hawaii Institute of Geophysics Technical Report No. 64-2, 95p.
Climatology From Buoys
TOPEX 1992-95 Wave Height Climatology From Altimeters Fall Winter THE OCEAN ATLAS OF HAWAII (Flament et al, 1996) Spring Summer Ave. Sig. Height (m)
Surf Climatology Caldwell, 2005, JCR
North Shore Surf Direction Climatology No. Days Per Month (> 2 Hsf) Caldwell, 2005, JCR
Surf Climatology Caldwell, 2005, JCR
Future Talks: Translation from Hawaii Scale to Trough-to-Crest Heights Waimea, Jan. 25, 2003, HSF=25 Photo:Jamie Ballenger
Empirical Estimate of Surf Height given Offshore Height and Period NWS High surf warning NWS High surf advisory Caldwell and Aucan, 2006, JCR
Peahi (Jaws), January 10, 2004, Hsf=27 Caldwell-Aucan Formula, Given 17’ 17sec, H1/3 = 40’ H1/10 = 52’ H1/100 = 70’ 5’ Photo: E.Aeder Surfer: P.Cabrina, Note: Billabong XXL 2004 winner, as 70’
Acknowledgements Surf Observations Surf News Network C&C Lifeguards Larry Goddard (1968-1987) Randy Rarick, Peter Cole, Bernie Baker, Albert Benson Pat’s support: Garrett McNamara, Clark Abbey, Ian Masterson, Kaleo Ahina, Jerome Aucan, Nathalie Zilberman, Thomas Decloedt, Cedric Chavanne, Sean Johnston, Eric Grossman, Yvonne Firing, Kimball Millikan, Rob Yonover, AJ Harris, Jeff Cotter, Robert Burke, and websites: Claudia Ferrari’s Daily Surf News, Surfline, and Jamie Ballinger’s Hawaiian Watershots Jerome Aucan Waimea buoy data, formula, review Steve Businger Review, plots Mark Merrifield, Chris Conger Review mahalo, aloha, a hui hou Photo: Patrick Holzman