Download

1 / 25
250 likes | 375 Views
Manipulation and Measurement of Variables. Psych 231: Research Methods in Psychology. Announcements. For labs this week you’ll need to download (and bring to lab): Class experiment packet. Choosing your independent variable.

E N D
Manipulation and Measurement of Variables Psych 231: Research Methods in Psychology
Announcements • For labs this week you’ll need todownload(and bring to lab): • Class experiment packet
Choosing your independent variable • Choosing the right range (the right levels) of your independent variable • Review the literature • do a pilot experiment • consider the costs, your resources, your limitations • be realistic • pick levels found in the “real world” • pick a large enough range to show the effect
Potential problems • These are things that you want to try to avoid by careful selection of the levels of your IV (issues for your DV as well). • Demand Characteristics • Experimenter Bias • Reactivity • Floor effects • Ceiling effects
Demand characteristics • Characteristics of the study that may give away the purpose of the experiment • May influence how the participants behave in the study
Experimenter Bias • Experimenter bias (expectancy effects) • the experimenter may influence the results (intentionally and unintentionally) • E.g., Clever Hans • One solution is to keep the experimenter “blind” as to what conditions are being tested • Single blind - experimenter doesn’t know the condition • Double blind - neither the participant nor the experimenter knows the condition
Reactivity • Having the participant knowing that their being measured • just being in an experimental setting, people don’t respond the way that they “normally” would. • “good” subjects - who try to figure out and confirm your hypothesis • “bad” subjects who try to mess things up.
Floor effects • A value below which a response cannot be made • Imagine a task that is so difficult, that none of your participants can do it. • As a result the effects of your IV (if there are indeed any) can’t be seen.
Ceiling effects • When the dependent variable reaches a level that cannot be exceeded • Imagine a task that is so easy, that everybody scores a 100% (imagine accuracy is your measure). • So while there may be an effect of the IV, that effect can’t be seen because everybody has “maxed out”. • So you want to pick levels of your IV that result in middle level performance in your DV
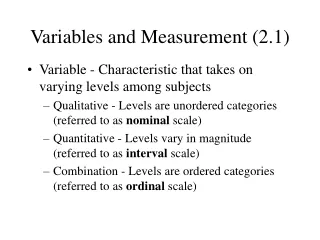
Measuring your dependent variables: • Scales of measurement • nominal scale • ordinal scale • interval scale • ratio scale • The scale that you use will (partially) determine what kinds of statistical analyses you can perform
Scales of measurement: • A nominalscale consists of a set of categories that have different names. • Measurements on a nominal scale label and categorize observations, but do not make any quantitative distinctions between observations. • Example: • Eye color: Brown, Blue, Black, Hazel, Green
Scales of measurement: • An ordinalscale consists of a set of categories that are organized in an ordered sequence. • Measurements on an ordinal scale rank observations in terms of size or magnitude. • Example: • T-shirt size: Sm, Med, Lrg, XL, XXL, XXXL
Scales of measurement: • An intervalscale consists of ordered categories where all of the categories are intervals of exactly the same size. • With an interval scale, equal differences between numbers on the scale reflect equal differences in magnitude. • Ratios of magnitudes are not meaningful. • Example: • Fahrenheit temperature scale 40º 20º “Not Twice as hot”
Scales of measurement: • A ratioscale is an interval scale with the additional feature of an absolute zero point. • With a ratio scale, ratios of numbers DO reflect ratios of magnitude. • Example: interval vs. ratio scales - measuring your height
Reliability and validity of your measures • Reliability • if you measure the same thing twice (or have two measures of the same thing) do you get the same values? • Validity • does your measure really measure what it is supposed to measure?
Reliability • True score + measurement error • A reliable measure will have a small amount of error • Test-restest reliability • Test the same participants more than once • Internal consistency reliability • Multiple items testing the same construct • Inter-rater reliability
Validity • Face validity • Construct validity • External Validity • Internal Validity • There are many others (e.g., convergent, discriminant,criterion, etc.)
Face Validity • At the surface level, does it look as if the measure is testing the construct?
Construct Validity • Usually requires multiple studies, a large body of evidence that supports the claim that the measure really tests the construct
External Validity • Are experiments “real life” behavioral situations, or does the process of control put too much limitation on the “way things really work?”
External Validity • Variable representativeness • relevant variables for the behavior studied along which the sample may vary • Subject representativeness • characteristics of sample and target population along these relevant variables • Setting representativeness • ecological validity
Internal Validity • The precision of the results • Did the change result from the changes in the DV or does it come from something else?
Threats to internal validity • History – an event happens the experiment • Maturation – participants get older (and other changes) • Selection – nonrandom selection may lead to biases • Mortality – participants drop out or can’t continue • Testing – being in the study actually influences how the participants respond • Statistical regression – regression towards the mean, if you select participants based on high (or low) scores (e.g., IQ, SAT, etc.) their scores later tend to move towards the mean.
“Debugging your study” • Pilot studies • A trial run through • Don’t plan to publish these results, just try out the methods • Manipulation checks • An attempt to directly measure whether the IV variable really affects the DV. • Look for correlations with other measures of the desired effects.
Next time • Read chapters 8. • Remember: For labs this week you’ll need todownload: • Class experiment packet