Download
1 / 12
120 likes | 216 Views
Explore data on financial security, business development, homeownership, healthcare, and education to understand economic opportunity through asset building. Discover insights and policy recommendations to foster equity.

E N D
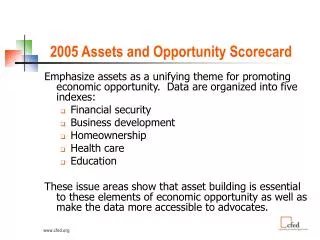
2005 Assets and Opportunity Scorecard Emphasize assets as a unifying theme for promoting economic opportunity. Data are organized into five indexes: • Financial security • Business development • Homeownership • Health care • Education These issue areas show that asset building is essential to these elements of economic opportunity as well as make the data more accessible to advocates.
Assets Across America: The National Picture • Nearly one in five households owes more than it owns. • One in four female-headed households has zero or negative net worth. • One in three minority-headed households has zero or negative net worth. • One in four families does not own enough to subsist at the poverty level for three months.
Assets across America: Financial SecurityFindings on Net Worth • For every one dollar in net worth of a household headed by a white adult, a minority-headed household has about 6 cents. • For every one dollar in net worth of a household headed by a male, a female-headed household has less than 40 cents.
Assets through a Gender Lens: Net worth • For every $1 in median net worth that a male-headed household has in DC, a female-headed household has 30 cents. • For every $1 in median net worth that a male-headed household has in Maryland, a female-headed household has 90 cents. • For every $1 in median net worth that a male-headed household has in Virginia, a female-headed household has 71 cents.
Assets through a Gender Lens: Asset poverty • Insufficient data available on DC to calculate asset poverty. • Women in Maryland are almost 70% more likely to be asset poor than men. • Women in Virginia are almost 50% more likely to be asset poor than men.
Assets through a Gender Lens: Homeownership • Women in DC are almost 90% as likely to own their own homes as men. • Women in Maryland and in Virginia are about 75% as likely to own their own homes as men.
Assets through a Gender Lens: High school attainment • For every 100 men who complete high school in DC, only 94 women do. • For every 100 men who complete high school in Maryland, 99.8 women do. • For every 100 men who complete high school in Virginia, only 99.5 women do.
Assets through a Gender Lens: College attainment • For every 100 men who complete high school in DC, only 78 women do. • For every 100 men who complete high school in Maryland, 84 women do. • For every 100 men who complete high school in Virginia, only 86 women do.
Asset Policies Favorable to asset building and protection: • DC • Property tax relief for all low-income homeowners. • Health coverage for poor adults. • Publicly-funded Head Start. • Maryland • High income tax threshold. • State EITC. • Unemployment benefit for entrepreneurs. • Virginia • State funding for IDAs. • Small business investment. • School spending equity.
Asset Policies Policy opportunities: • DC • Institute short-term loan protections. • Create incentives for private lenders. • Maryland • Raise state minimum wage above federal level (or at least to match it). • Use bonds for homeownership assistance. • Virginia • Raise unemployment insurance benefits. • Publish a regular tax expenditure report.
www.cfed.org/go/scorecard • All data available for download • State summary of data • List of advocacy organizations by location and issue area expertise • CFED’s center for policy advocacy • Guide to create state scorecard • Suggestions for using the Scorecard