Download

1 / 1
10 likes | 192 Views
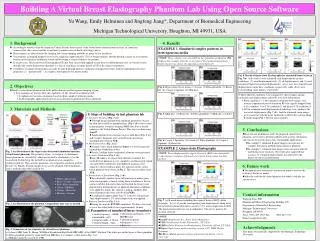
Building A Virtual Breast Elastography Phantom Lab Using Open Source Software. Yu Wang, Emily Helminen and Jingfeng Jiang*, Department of Biomedical Engineering Michigan Technological University , Houghton, MI 49931, USA. 1. Background

E N D
Building A Virtual Breast Elastography Phantom Lab Using Open Source Software Yu Wang, Emily Helminen and Jingfeng Jiang*, Department of Biomedical Engineering Michigan Technological University, Houghton, MI 49931, USA • 1. Background • According to statistics from the American Cancer Society, breast cancer is the second most common form of cancer in American women (after skin cancer) and the second most common cause of death (after lung cancer). • Breast tumors are often detected by imaging, but current imaging methods are prone to low specificity. • Uncertainties in imaging diagnosis have led to a high rate (approximately 75%) of benign biopsies, thereby placing a major socio-economic burden on the American healthcare system and becoming a source of distress for patients. • In recent years, Ultrasound-based Elastography (UE) has been successfully applied to non-invasive differentiation of in vivo breast lesions, though early results demonstrate that there is a lack of confidence in image details of UE in the clinical community. • Confidence on image interpretations can only be gained through rigorous validationof image pixel values with the underlying soft tissue properties (i.e. “ground truth”) in complex, heterogeneous but known media. 4. Results EXAMPLE 1. Simulated complex patterns in heterogeneous media *NOTE: Three volumes were selected from the virtual breast phantom (Fig. 1 (a)) in this example.Only the center plan of the simulated impendance field (volume) was shown, the impedance unit is kg/(s·m2). Fig. 8.Result of Quasi-static Elastography for simulated breast lesion in Fig. 7(a). (a)(b) and (c) were estimated axial displacements in three conditions: (1) axial displacement only; (2) all displacements; and (3) axial, lateral and tripled elevational displacements. (a)-(c) were the estimated axial displacements under three conditions, respectively, while (d)-(f) were corresponding strain images, respectively. • 2. Objectives • Build a virtual breast phantom lab in the public domain used for rigorous imaging testing. • Two examples are used to show the capabilities of this virtual breast phantom lab. • A sophisticated acoustic simulation based on three complex but known media. • An Elastographic application based on an un-deformed and deformed breast phantom. Fig. 4. Hypo-echoic breast lesion. (1) Lesion. (2) Fibro-glandular. (3) Breast fat. (4). Cooper’s ligament. (5) Milk duct. • Three different conditions were compared to show changesamong estimated axial displacements caused by non-axial deformations. • From conditions 1-3, the estimated correlation between pre- and motion-compensated post-deformation RF echo signals dropped from 0.81 (condition 1) to 0.78 (condition 2) and then to 0.70 (condition 3). • All the estimated axial displacement distributions were similar to the true axial displacement (Fig. 7 (b)). And the estimated strain images were consistent with the tissue landmarks visible in the corresponding B-mode image (Fig. 7 (a)) but more complex. 3. Materials and Methods (1) Steps of building virtual phantom lab • Geometry Creation (Fig. 1 (a)) • Through image segmentation, landmark geometries such as the skin layer and fibro-glandular layer (Fig. 3 (b)) were created using magnetic resonance imaging (MRI) data from a female cadaver in the Visible Human Project. This step was done using ScanIP. • Small random tissue structures such as milk ducts (Fig. 3 (c)) and Cooper’s ligaments were created based on in-house algorithm derived fromVTK. • Mesh Generation (Fig. 1 (c)) • An open source mesh generator Tetgen was used to generate high quality tetrahedral meshes. • Nearly 2 million finite (tetrahedral) elements were generated. • Acoustic Simulation (Fig. 1 (d)) • Since K-wave is a k-space finite difference method, the meshed breast phantom was re-sampled to rectilinear grid. Speed of sound (SOS) and density from different materials were asigned to these rectilinear grids. Six materials in this virtual breast phantom were shown in Fig. 2. This step was done using VTK. • Biomechanical Simulation (Fig. 1 (b)) • To realistically simulate tissue deformations to mimic quasi-static elastography, a clinical setting linear transducer is first in contact with the skin and is then used to push the breast tissue downward to deform this breast phantom. Boundary conditions were applied to mimic this clinical scanning condition. This finite element results were solved using FEBio. • A small patch (approxiately 4cm×1.5cm) was selected and 1mm displacement (1.5% axial compression) was applied. • Running Simulation (Fig. 1 (e)) • During the acoustic K-WAVE simulation, 256 lines were used to cover the entire field of view (approximately 36 mm). (2) Parameters of simulated linear transducer Fig. 5. Milk-duct. (1) Breast fat. (2) Fibro-glandular. (3) Milk duct. (4) Lobe. 5. Conclusions • Based on our preliminary study, the proposed virtual breast phantom can be used to perform sophisticated acoustic simulations and can also be used in quasi-static elastography applications. • In example 1, simulated B-mode images can represent the complex but known medium shown in breast phantom. • In example 2, estimated stain images were consistent with the underlying tissue elasticity. Our results also suggested that accuracy of estimated displacements was affected by the degree of non-axial deformation. Fig. 6. Cooper’s ligaments. (1) Lesion. (2) Fibro-glandular. (3) Cooper’s ligament. (4) Breast fat. EXAMPLE 2. Quasi-static Elastography Fig. 1. An illustration of the steps in our ultrasound simulationbased on virtual breast phantom. The geometry of pre- (a) and post- (b) deformed breast phantom are created first, which are meshed to tetrahedrons (c) in the second step. In third step, the meshed breast phantom is re-sampled to rectilinear grid (d). Then acoustic parameters are assigned to rectilinear grid for K-wave (e). Finally, B-mode images (f) (g) can be obtained. The deformation area is marked using white circle in (b). *NOTE: Tissue displacement in region of interest (ROI) was estimated by comparing pre- and post- deformed echo signals using motion tracking method. 6. Future work • Incorporate more anatomical structures in order to increase the realism of the breast model. • Make the code for the virtual phantom lab widely available for anyone to use. • White---Breast skin • Blue---Cooper’s ligament • Red---Fibro-glandular • Green---Milkduct • Orange---Breast fat • Maroon ---Lesion Contact information Jingfeng Jiang, PhD Material and Mineral Engineering Building 309, Department of Biomedical Engineering, Michigan Technological University Houghton, MI 49931 Voice: (906)-487-1943, Fax: (906)-487-1717 Email: jjiang1@mtu.edu Fig. 7. (a) B-mode image including the region of interest (ROI) (white rectangle). (b) (c) (d) are the corresponding true displacements along axial, lateral and elevational directions caused by 1.5% axial compression in ROI. The displacement color bars are in millimeters. The arrows point to the position of lesion. Fig. 2. An illustration of the phantom. Compositions may vary as needed. • attenuation coefficient---0.75 dB/MHz/com • attenuation power w/frequency ---1.5 • B/A ---6 • center frequency---6MHz • bandwidth---80% • element width---0.15mm • element height---5mm *NOTE: • ScanIP (Simpleware Inc., Exter, United Kingdom) • VTK (Visualization Toolkit, Kitware Inc., NY, USA) • FEBio (Finite Elements for Biomechanics, University of Utah, UT, USA) • Tetgen (Open source mesh generator, version 1.4.2; WIAS, Berlin, Germany) • K-Wave (Matlab package used for ultrasound simulation, www.k-wave.org) Acknowledgments This project was partially supported by the Michigan Technology University. Fig. 3. Geometries of two structures in virtual breast phantom. (a) A breast MRI, from W. Huang, WM Keck Foundation High-Field MRI-AIRC at the OHSU, Portland. The white area in this figure is fibro-glandular. (b) Fibro-glandular geometry segmented from MRI data. It is similar to white area in Fig. 3 (a). (c) Milkduct geometry created by VTK.