Download
1 / 1
10 likes | 141 Views
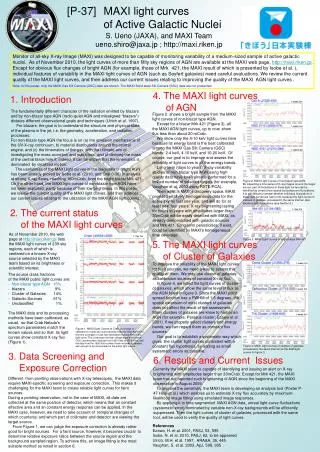
[P-37] MAXI light curves of Active Galactic Nuclei. S. Ueno (JAXA), and MAXI Team ueno.shiro@jaxa.jp ; http://maxi.riken.jp.

E N D
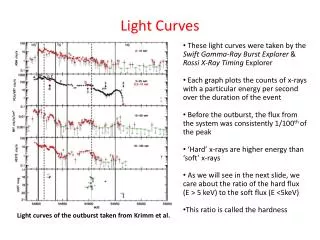
[P-37]MAXI light curves of Active Galactic Nuclei S. Ueno (JAXA), and MAXI Team ueno.shiro@jaxa.jp ; http://maxi.riken.jp Monitor of all-sky X-ray Image (MAXI) was designed to be capable of monitoring variability of a medium-sized sample of active galactic nuclei. As of November 2010, the light curves of more than fifity sky regions of AGN are available at the MAXI web page, http://maxi.riken.jp/. Except for obvious flux changes of bright AGN (for example, those of Mrk421, the MAXI result of which is presented by Isobe et al. ), individual features of variability in the MAXI light curves of AGN (such as Seyfert galaxies) need careful evaluations. We review the current quality of the MAXI light curves, and then address our current issues relating to improving the quality of the MAXI AGN light curves . Note: In this poster, only the MAXI Gas Slit Camera (GSC) data are shown. The MAXI Solid-state Slit Camera (SSC) data are not presented. 4. The MAXI light curves of AGN 1. Introduction 1-week bin The fundamentally different character of the radiation emitted by blazars and by non-blazar type AGN (radio-quiet AGN and misaligned “blazars”) dictates different observational goals and techniques (Ulrich et al. 1997). For blazars, the goal is to understand the structure and physical state of the plasma in the jet, i.e. the geometry, acceleration, and radiation processes. For non-blazar type AGN the focus is on (a) the emission mechanisms of the UV-X-ray continuum, b) material distributions around the central engine, and (c) the kinematics of the gas, with the ultimate aim of investigating the mass accretion and mass loss, and of deriving the mass of the central black hole if, indeed, it can be shown that the kinematics is dominated by virialized motion. The usefulness of the MAXI light curves in the diagnosis of bright AGN has been already proved by Isobe et al. (2010, and Oral 0-36) in analysis of strong X-ray flares, reaching 160mCrab, from the bright blazar Mrk 421. On the other hand, the MAXI light curves of non-blazar type AGN have not been exploited, partly because of their low brightness. In this poster, we review the current quality of the MAXI light curves, and then address our current issues relating to the utilization of the MAXI AGN light curves. Figure 2 shows a bright sample from the MAXI light curves of non-blazar type AGN. Except for a blazar Mrk 421 (Figure 3), all the MAXI AGN light curves, up to now, show flux less than about 20 mCrab. We show only the 4-10 keV light curves here because its energy band is the best calibrated among the MAXI Gas Slit Camera (GSC) bands: 2-4 keV, 4-10 keV, and 10-20 keV. Of course, our goal is to improve and assess the reliability of light curves in all the energy bands. Long-term (days to years) X-ray variability studies of non-blazar type AGN using high quality data have been already performed for a limited number of selected targets (for example, Vaughan et al. 2003 using RXTE/PCA). Then what is MAXI’s discovery space. MAXI provided relatively homogeneous data for the entire sky for last one year, and will do for at least next four years. X-ray brightening lasting for hours to years with amplitudes larger than 30mCrab will be easily detected with MAXI, as already demonstrated with galactic sources and Mrk 421. Long-term periodicities, if exist, could be identified by MAXI’s homogeneous time coverage. 1-week bin 1-week bin Figure 2. MAXI Light Curves of non-blazar type AGN. By inspecting a time series of X-ray images around the target source, part of fluctuations in these light curves cab be identified as unreal ones caused by background fluctuations. It is still difficult to answer whether individual fluctuations in these light curves are real or not, because the light curves of clusters of galaxies, processed in the same manner, also shows similar fluctuations (see Section 5.) 2. The current status of the MAXI light curves 1-day bin As of November 2010, the web page at http://maxi.riken.jp/ lists the MAXI light curves of 239 sky regions, each of which is centered on a known X-ray source selected by the MAXI team based on its brightness or scientific interest. 1-day bin Figure 3. MAXI Light Curves of bright blazar Mrk 421 5. The MAXI light curves of Cluster of Galaxies To improve the reliability of the MAXI light curves for faint sources, we need a way to assess the quality of them. We may use cluster of galaxies as calibration sources of constant X-ray flux. In figure 4, we listed the light curves of cluster of galaxies, which show the same level of flux as the AGN listed in figure 3. Since the MAXI point spread function has a FWHM of 1.5 degrees, the spatial extension of most clusters of galaxies does not affect the result of the assessment. Many clusters of galaxies are know to harbor an AGN (for example, Perseus cluster; Ezawa et al. 2001). If we properly select clusters and energy bands, we can regard them as constant flux sources. Our goal is to establish a systematic way which gives the cluster light curves consistent with a constant flux hypothesis, by adding as small systematic errors as possible. 1-week bin • The source class fractions • of the MAXI public light curves are: • - Non-blazar type AGN 15% • blazars 9% • Cluster of Galaxies 14% • Galactic Sources 61% • Unclassified 1%. • The MAXI data and its processing • methods have been calibrated, as usual, so that Crab Nebula’s spectrum parameters match the known values and so that its light curves show constant X-ray flux (Figure 1). 1-week bin 1-week bin Figure 1. MAXI Light Curves of Crab, as a result of calibrations of data and its processing methods. After April 2010, the time coverage of Crab has decreased to about 50% in this light curve. This is because the high voltage supplied to some GSC counters were reduced from 1650 Volts to 1550 Volts, and the data from the 1550-Volt counters have not been calibrated well enough to be incorporated in the public light curves. Figure 4. MAXI Light Curves of clusters of galaxies, processed in the same manner as the AGN light curves in Figure 3. 3. Data Screening and ExposureCorrection 6. Results and Current Issues Currently the MAXI team is capable of identifying and issuing an alert on X-ray brightening with amplitudes larger than 30mCrab. Except for Mrk 421, the MAXI team has not reported such brightening of AGN since the beginning of the MAXI observation in August 2009. To improve the sensitivity, the MAXI team is developing an analysis tool (Poster P-47 Hiroi et al.) which enables us to estimate X-ray flux accurately by maximum-likelihood image fitting using simulated image responses. By applying it to time-segmented MAXI AGN data, unreal light-curve fluctuations (systematic error) dominated by variable non-X-ray backgrounds will be efficiently suppressed. Then the light curves of cluster of galaxies, processed with the same tool, will be used to verify the quality of light curves. Different from pointing observations with X-ray telescopes, the MAXI data require MAXI-specific screening and exposure correction. This makes it challenging for the MAXI team to create reliable light curves for faint sources. During a pointing observation, not in the case of MAXI, all date are collected at the same position of detector, which means that an constant effective area and an constant energy response can be applied. In the MAXI case, however, we need to take account of temporal changes of which counter(s) and which part of collimator and detector are viewing the target source. From Figure 1, we can judge the exposure correction is already rather good for bright sources. For a faint source, however, it becomes crucial to determine relative exposure ratios between the source region and the background sampled region. To achieve this, an image fitting is the most suitable method as noted in section 6. References Ezawa, H. et al. 2001, PASJ, 53, 595 Isobe, N. et al. 2010, PASJ, 62, to be appeared Ulrich, M.H. et al. 1997, ARA&A, 35, 445 Vaughan, S. et al. 2003, ApJ, 598, 935