Download
1 / 55
550 likes | 635 Views
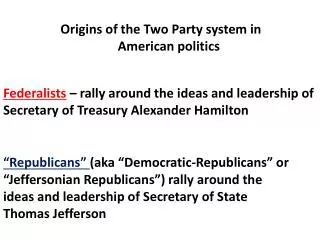
PARTY IDENTIFICATION IN THE AMERICAN ELECTORATE. Nicholas R. Miller Department of Political Science UMBC. The “Fundamentals”. The outcomes [division of the popular vote] of U.S [Presidential] elections depend almost entirely on “fundamentals,”

E N D
PARTY IDENTIFICATIONIN THE AMERICAN ELECTORATE Nicholas R. Miller Department of Political Science UMBC
The “Fundamentals” • The outcomes [division of the popular vote] of U.S [Presidential] elections depend almost entirely on “fundamentals,” • not campaign resources and tactics, gaffes, etc. • What are these fundamentals? • First, most voters have made a “standing decision” to support one or other party and only vote otherwise exceptionally. • Second, certain given facts (especially the state of the economy) largely determine how the remaining voters will vote (or how many other voters may change their “standing decision”). • But if the fundamentals point to a close election, the other factors may determine the winner.
Fundamental 1: Party Identification • Surveys provide an alternative to analyzing aggregate records • Gallup and Roper polls in 1930s • First academic survey-based voting study, The People’s Choice: How the Voter Makes Up His Mind in Presidential Campaign [1940 election] • Columbia University sociologists • based on random sample of population (subject to sampling error) • local survey (Sandusky and Eire County, OH) • face-to-face personal interviews • panel survey (same respondents interviewed six times May-Nov) • three control groups • emphasizing groups affiliations and interpersonal influence • context of 1940 Presidential contest • researchers’ expectations: more or less “rational voter” • but in fact, most voting intentions were fixed early and rarely changed • Index of Political Predisposition (IPP)
Party Identification (cont.) • The American Voter, 1952 and 1956 • University of Michigan social psychologists political scientists • emphasizing opinions, attitudes, and orientations • national survey • face-to-face personal interviews • limited panel survey (pre- and post-election interviews) • “Michigan Studies” evolved into the NSF-funded (American) National Election Studies
American National Election Studies • ANES studies have been held in conjunction with every Presidential election since 1952 (and most off-year) Congressional elections. • A large portion of political science knowledge concerning U.S. electoral behavior is derived from this series of studies. • Each ANES is a survey of approximately one to two thousand randomly selected respondents who collectively constitute a representative sample of the American voting-age population at the time. • Cumulative Data File
Survey Research • Survey research [“polling”]: two-step process to gather data. • Select a representative sample of the public. • This can be done by selecting a random sample of the public. • The mathematical laws of probability assure us that the sample will be a representative sample of the public, • with a margin of error that depends on the size of the sample. • But even small samples (e.g., 1500-2500) have quite small (e.g., ± 3%) margins of error. • It takes fairly elaborate procedures to select a random sample. • Work hard to get a high response rate. • Interview respondents (over the phone or, preferably, in person) using • a standard questionnaire • with carefully designed and unbiased questions.
Party Identification (cont.) Generally speaking, do you think of yourself as a Democrat, Republican, Independent, or what? [If Dem/Rep] Would you call yourself a strong Dem/Rep or a not very strong Dem/Rep? [If Ind] Do you think of yourself as closer to the Democratic Party or the Republican Party? Note: face-to-face personal interview, not paper & pencil or telephone. • Party ID – Seven-Point Scale Strong Democrat Weak Democrat Democratic Leaner Pure Independent Republican Leaner Weak Republican Strong Republican [Other, DK] • Note: very few Other/DK; relationship between weak/leaner categories
Properties of Party Identification • What party ID is not • current vote intention, most recent vote, voting history, etc. • ideology: liberal vs. conservative • how voter is registered • formal membership • Party ID is a psychological attachment to a political party • in U.S. party ID is widespread • most people vote consistently with party ID most the time • probably not hugely salient, except in political/electoral context • concept may not travel well to most other countries • Stable, at least in 1950s • maybe second only to religious identification • strength of party ID increases with age
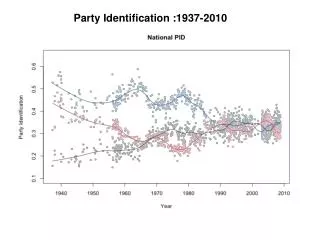
Stability Of Party Identification in 1950s (based on 1956-68-60 panel)
IDEOLOGY • We hear a lot of talk these days about liberals and conservatives. Where would you place yourself in these terms or haven’t you thought much about this? • Liberal • Slightly liberal • Moderate/middle of road • Slightly conservative • Conservative • Haven’t thought much about this (~30%)
Party ID and Ideology • Note the anomaly: • more Democrats than Republicans, but • more conservatives than liberals.
Ideology at the Mass Level • Abortion and Health Insurance opinions are largely unrelated.
Party Identification “Colors” Presidential Approval (and other opinions)