Download
1 / 24
240 likes | 350 Views
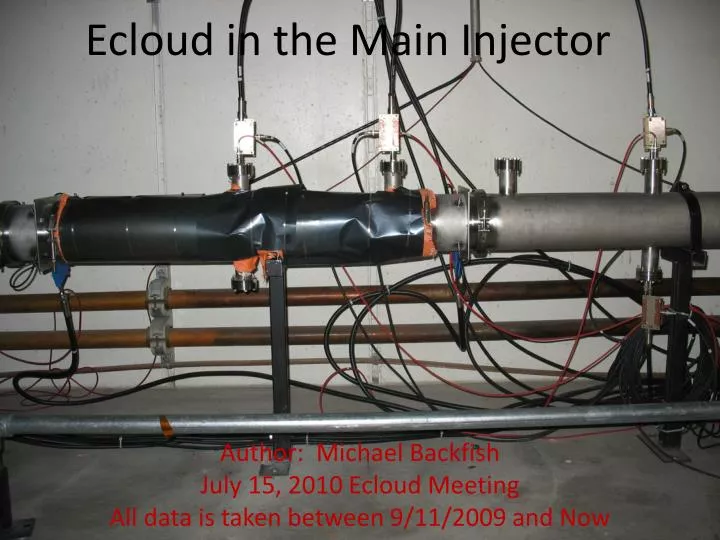
Ecloud in the Main Injector. Author: Michael Backfish July 15, 2010 Ecloud Meeting All data is taken between 9/11/2009 and Now. Ecloud Detector Signals With Main Injector Beam Intensity and Ramp.

E N D
Ecloud in the Main Injector Author: Michael Backfish July 15, 2010 EcloudMeeting All data is taken between 9/11/2009 and Now
Ecloud Detector Signals With Main Injector Beam Intensity and Ramp
By datalogging our signals at a time that will give us a sample of the maximum signal achieved, and then plotting the data vs beam intensity we can see how the signal changes with an increase in beam intensity.
Basic Method Data Log detector signals on an event at the time when the signal is maximum Export 1 file from D44 for each day Use Excel to Remove any duplicate values because Mathematica does not like to fit a function if there is more than 1 Y value for every X value Save it as a text file which will then be accessed with Mathematica Use Mathematica to filter out unwanted data (overdriven signals or timing jitter which will be shown later) Fit a curve that we will be able to track through time
Data Exported From D44Filter for any duplicate I:BEAM values in excel and save as a txt file
Timing JitterWe initially data logged on the $8D in order to only see Pbar/Numi pulses. For some unknown reason a jitter occurs when using this event.In early March we found that Data logging on the $8E alleviated this jitter $8D $8E
Timing JitterWe initially data logged on the $8D in order to only see Pbar/Numi pulses. For some unknown reason a jitter occurs when using this event.In early March we found that Data logging on the $8E alleviated this jitter I:CLOUD1 I:BEAM
Different Bunch StructureShows different charactersitics than timing jitter
Signal=z-e^(a*(x-X0))x is the beam intensityWhen x=X0 the signal equals z-1Thus by tracking X0 we can track the conditioning of the beam pipe over time
I:BEAM is datalogged on the $AD for every Numi pulse since the beginning of the last shutdown Since we now have an equation Signal=z-e^(a*(x-X0)) We can use I:BEAM data from each pulse to know the maximum value that our signal reached
Knowing the maximum detector signal for each I:BEAM pulse allows to extrapolate a curve for each pulse. A Lorentzian fit works for a rough estimate.Signal=a/[(x-x0)^2+λ]RFA1 RFA3
Every day we find the integral of the lorentzian for each Numi beam pulse and sum them all. We the do a net sum for each consecutive day. Thus it is the sum of the integral of our extrapolated lorentzian function for every beam pulse. Note the different scales on the two plots below.
Still need to convert this to total charge • There is a 40 dB gain in the preamp thus V1*100=V2 where V2 is what we see upstairs. • Based on the preamp design the electrons see a 1 MW resistance thus: (V2/100)/1 MW = I • Using Lee’s data we also know that between 18 and 22 Volts on the grid our detector has about a 62% efficiency. • Lastly we will compensate for lost signal due to the escape slits in the beam pipe. Using this we can convert our Integral of a Voltage signal to a true charge sum and correct the units on the plots………..I just have not done it yet.
Zooming in on RFA3 We no longer see the gaussian like shape, but we do still get a small signal that increases through the entire cycle
An interesting little experiment3 Bump at HP520 and VP521 slot 5
Note I:CLOUD1 and I:CLOUD4 are facing each other with one the top and the other on the bottom
Things to think about: • Still working on calibrating hall probes to measure the MI bus magnetic field. • If we install the Carbon coated beam pipe what better ways do we have to take data?