Download
1 / 34
440 likes | 830 Views
Washington University Computational Fluid Dynamics Laboratory. Coal-Direct Chemical Looping Combustion: Process and Reactor Level Simulations and Optimization of Carbon Capture. Ramesh K. Agarwal Washington University in St. Louis rka@wustl.edu.

E N D
Washington University Computational Fluid Dynamics Laboratory Coal-Direct Chemical Looping Combustion: Process and Reactor Level Simulations and Optimization of Carbon Capture Ramesh K. Agarwal Washington University in St. Louis rka@wustl.edu International Workshop on Novel Combustion for Sustainable Energy Development IIT Kanpur, India 2-4 January 2014
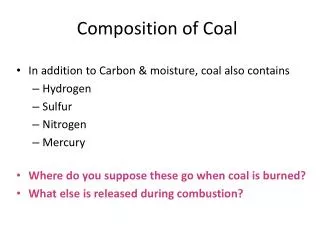
Depleted Air, CO2 & H2O Reduced Metal Oxide Air Coal, CH4 Oxygen Carrier Air Reactor Fuel Reactor Introduction The need for carbon capture with high efficiency & low cost… Chemical-looping-combustion (CLC) typically employs a dual fluidized bed system (circulating fluidized bed process) where oxygen carrier (OC) is employed as a bed material providing the oxygen for combustion in the fuel reactor. The reduced OC is then transferred to the second bed (air reactor) and re-oxidized before being reintroduced back to the fuel reactor completing the loop. Why CLC is appealing… High purity CO2 is readily available at outlet of the fuel reactor due to the absence of air in the fuel reactor Estimated energy cost of solid circulation (which is the only energy cost of separation) is as low as approximately 0.3% of total energy released by the combustion process High power plant efficiencies (greater than 50% ) can be achieved along with nearly complete CO2 capture CLC holds significant promise as a next generation combustion technology due to its potential to allow high purity CO2 capture with minimal effect on the efficiency of the power plant.
Technology Advantage/Disadvantage “CLC is the leapfrog technology with potential to achieve significantly lower costs than PC/CFB/IGCC” - Alstom Group Advantages come with a price tag
System-level process modeling by ASPEN Plus Modeling of CLOU Process (Sahiret al.’s experiment) • This system-level ASPEN Plus model is established according to the laboratory-scale CLC apparatus used by Sahir et al. in their experimental study. • The laboratory-scale plant employs a coal directed CLC process with 430 kW thermal output utilizing Fe2O3 (with Al2O3 as supporting material) as the oxygen carrier. • Pulverized Colombian coal is fed directly into the fuel reactor. System model flow chart
System-level process modeling by ASPEN Plus Modeling of CLOU Process (Sahiret al.’s expriment) Energy analysis for each component
System-level process modeling by ASPEN Plus Modeling of CLC Process (Krampet al.’s experiment) • This system-level ASPEN Plus model is established according to the laboratory-scale CLC apparatus used by Kramp et al. in their experimental study. • The laboratory-scale plant employs a coal directed CLC process with 25kW thermal output utilizing ilmenite as the oxygen carrier. • Pulverized RWE brown coal is fed directly into the fuel reactor. System model flow chart Process efficiency evaluation
Multi-Phase CFD/DEM Simulation Equations Governing Fluid Equations • Governing Particle Equations Fgra =volume forces due to gravity, Fbuo=buoyancy force, Fdrag = drag force due to fluid viscosity, Fpre, =pressure force due to pressure gradient , Fsaff = Saffman lift force due to inter-particle friction, Fmag = Magnus force due to the spinning motion of the particles respectively, Fcon= short-range contact force between the particles. Fpre and FMag are dropped in the calculation without significant effect on accuracy.
Particle Collision Model for DEM Soft Model Based on Hooke’s Law The contact force is decoupled in tangential and normal components. k= spring constant of the pair of particles for collision, δ= overlap of the particle pair for collision, γ= damping coefficient, u12 = relative velocity between the collision pair, e =the unit vector. The tangential frictional force between the two colliding particles is evaluated as Schematic of particle collision model for DEM
Calculation of Drag Force and Source Term Calculation of Drag Force u= gas velocity vector, up= particle velocity vector, FD = drag coefficient • Multi-Phase Exchange Coefficient – Source Term in Momentum Equation Sp = βsg(uf – up)
Reactor-level modeling in ANSYS Fluent Simulation of fuel reactor using Eulerian-Eulerian approach (Son and Kim’s experiment) • A laboratory scale CLC demonstration utilizes CH4 as the fuel and Fe2O3 and NiO mixture as the oxygen carrier. • It provides the steady-state reactor performance at various operations conditions, in particular the fluidization velocity and metal oxide concentration. Chemical reactions in fuel reactor: 12Fe2O3+CH4 -> 8Fe3O4+2H2O+CO2 4NiO+CH4 -> 4Ni+2H2O+CO2 Rate of consumption of metal oxide:
Reactor-level modeling in ANSYS Fluent Simulation of fuel reactor using Eulerian-Eulerianapproach (Son and Kim’s experiment) Time-dependent variation of flue gas (dry) concentration at the outlet Time variation of CH4 concentration (left) and CO2 concentration (right) under inlet velocity of 100 mm/s, CFD simulation Inlet-velocity-dependent flue gas (dry) concentration at the outlet Outlet composition of flue gases at various inlet velocities, experiment and CFD simulation
Reactor-level modeling in ANSYS Fluent Simulation of fuel reactor using Eulerian-Eulerian approach (Son and Kim’s experiment) Solids volume fraction and gas velocity in the FR at VCH4= 50 mm/s
Reactor-level modeling in ANSYS Fluent Simulation of fuel reactor using Eulerian-Eulerianapproach (Son and Kim’s experiment) Solids volume fraction and gas velocity in the FR at VCH4= 75 mm/s
Reactor-level modeling in ANSYS Fluent Simulation of fuel reactor using Eulerian-Eulerian approach (Son and Kim’s experiment) Solids volume fraction and gas velocity in the FR at VCH4= 100 mm/s
Reactor-level modeling in ANSYS Fluent Simulation of fuel reactor using Eulerian-Lagrangian approach (TU-Darmstadt experiment) • Higher accuracy and capturing of some critical phenomena in CLC (e.g. oxygen carrier recirculation) requires simulation of inter-particle collision, i.e., tracking of individual particle. • Larger oxygen carrier is needed for the coal-direct CLC process due to the purpose of particle separation. Oxygen carrier Coal TU-Darmstadt sprout fluidized bed apparatus
Reactor-level modeling in ANSYS Fluent Simulation of fuel reactor using Eulerian-Lagrangian approach (TU-Darmstadt experiment) Why particle tracking in Lagrangianframework (DEM) is critical? Detailed description of particle-particle/particle-wall interaction can only be capture by DEM • Eulerian-Eulerianin FLUENT • TU-Darmstadt Experiment t=416ms t=312ms t=358ms t=416ms t=312ms t=358ms Discrete Element Method Granular Flow Method
Reactor-level modeling in ANSYS Fluent Simulation of fuel reactor using Eulerian-Lagrangian approach (TU-Darmstadt experiment) Expansion of bed, 0~200 ms of jet injection FLUENT/DEM 80 ms 200 ms 160 ms 0 ms 20 ms 40 ms 180 ms 60 ms 100 ms 120 ms 140 ms TU-Darmstadt Exp.
Simulation of fuel reactor using Eulerian-Lagrangian approach (TU-Darmstadt experiment) Reactor-level modeling in ANSYS Fluent Expansion of bed, 220~460 ms of jet injection FLUENT/DEM 400ms 340 ms 380 ms 220 ms 240 ms 260 ms 280 ms 300 ms 320 ms 360 ms 420 ms 440 ms 460 ms TU-Darmstadt Exp.
Reactor-level modeling in ANSYS Fluent Excellent agreement of the expansion of bed height with the experiment is obtained from the simulation, including the bed height, its expansion rate, and the prediction of bubble burst. The pressure loss at four locations on the right wall (z=2cm, 12cm, 22cm, 40cm) does not match with the experimental monitoring well due to the relatively coarse mesh in the flow field. However, this is still a technical limitation of the FLUENT/DEM solver. Simulation of fuel reactor using Eulerian-Lagrangian approach (TU-Darmstadt experiment) Temporal distribution of bed height, simulation and experiment Temperoal distribution of pressure loss, simulation and experiment
System-level modeling in ANSYS Fluent Based on the TU Darmstadt experiment, a completed CLC design prototype has been modeled. The bed expansion, particle separation, and particle recirculation is to be investigated. If necessary, suggestions on the prototype design is to be given based on the simulations. Simulation of particle recirculation using Eulerian-Lagrangian approach A complete loop CLC prototype Mesh Framewire Geometry
Reactor-level modeling in ANSYS Fluent Simulation of particle recirculation using Eulerian-Lagrangian approach Complete loop simulation (40 ~ 940 ms), particles colored by its velocity magnitude.
Streamlines due to Variation in Static pressure (in color) in the Complete CD-CLC Configuration for the First 800 ms of Jet Injection
Static Pressure in CD-CLC System at Five Pressure Taps 400 ms 800 ms
Key Performance Issues with TU - Darmstadt Complete CD-CLC Configuration It is noted from these simulations that the continuous formation of new bubble and solid recirculation from the loopseal to the fuel reactor are the two key factors for successful CD-CLC operation, which however were not satisfactorily achieved in the simulation results for the considered CD-CLC configuration used in the experiment at TU-Darmstadt. Therefore, a new configuration was designed to mitigate these two factors, that is to enhance the particle recirculation in the fuel reactor as well as in the entire system and to increase the possibility of continuous bubble formation.
Geometry of the Modified CD-CLC Configuration Geometry with Pressure Taps Mesh Wire Frame
Particle Distributions and Velocity Magnitudes (in color) in the Modified CD-CLC Configuration for the 720 ms of Jet Injection
Particle Distributions and Velocity Magnitudes (in color) in the Modified CD-CLC Configuration for the 760 -1440 ms of Jet Injection
Particle Distributions and Velocity Magnitudes (in color) in the Modified CD-CLC Configuration for the 1440 -1800 ms of Jet Injection
Static Pressure at Five Pressure Taps in Modified CLC System 400 ms 800 ms
Static Pressure at Five Pressure Taps in Modified CLC System 1200 ms1600 ms
Acknowledgements The financial support provided by the Consortium for Clean Coal Utilization (CCCU) at Washington University in St Louis is gratefully acknowledged. The information/experiment data provided by our collaborators Darmstadt University of Technology, University of Utah, and Chalmers University of Technology is gratefully acknowledged. A high fidelity simulation tool that can be used in the design of an industrial-scale CLC system “No smoke, no fire, CLC is a new clean coal technology.” - Clean Coal Research Lab, Ohio State University
Multi-Phase CFD Simulation Equations Eulerian-Eulerianapproach (Granular Flow Approximation) Hydrodynamics Equations: The solid phase is assumed to be continuum, i.e. the hydrodynamics of both the gas and solids can be described by the multi-phase continuity, momentum, and energy equations Chemical Kinetics: According to Son and Kim, and Mattisson et al., the chemical kinetics of the above reactions can be modeled such that the rate of consumption of Fe2O3 and NiOis given by: