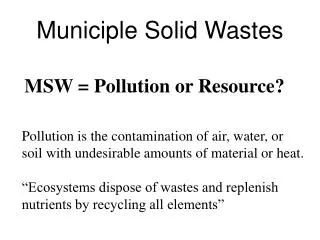
Understanding Solid Waste Management: Challenges, Solutions, and Historical Perspectives
This comprehensive overview explores the composition of solid waste in the U.S., distinguishing between municipal, industrial, and agricultural waste. It discusses the modern sanitary landfill system, incineration processes, and the critical importance of recycling plastics and metals. The text also examines the Resource Conservation and Recovery Act (RCRA) and Superfund programs aimed at waste management and environmental protection. Additionally, historical insights into waste management practices from ancient to modern times are provided, highlighting the evolution and challenges in managing the waste stream.

Understanding Solid Waste Management: Challenges, Solutions, and Historical Perspectives
E N D
Presentation Transcript
Potential Exam Questions • 1. Discuss the composition of solid waste in the United States. Distinguish between municipal waste and other producers of waste. 2. Describe the features of a modern sanitary landfill and relate some of the problems associated with sanitary landfills.
Potential Exam Questions • Describe the features of a mass burn incinerator and relate some of the problems associated with incinerators. • With regard to plastics and metals, discuss the benefits of recycling and the environmental costs of not recycling. Explain why such a small percentage of metal and plastic is recycled in the U.S. • Discuss RCRA and the Superfund program. In your discussion, include an explain of the main goals of each program.
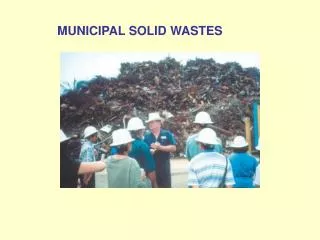
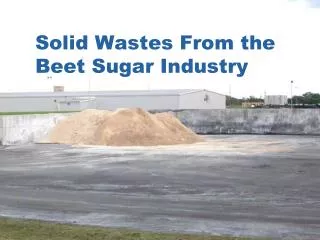
Waste Stream • The waste stream is the flow of wastes we produce. • USA produces more than 11 billion tons of solid waste each year. USA volume has doubled since 1960. Agricultural wastes - crop and animal residue Mining - mine tailings, overburden, slag Industrial waste Municipal waste
Types: • Pesticides • Carcasses • Horticultural wastes • Animal feces (e.g., reported that North Carolina’s hogs outnumber its citizens and produce more fecal waste than all the people in California, New York, and Washington combined. Each day the Arkansas poultry industry dumps urine/feces equal to the daily waste generated by a population of 8 million people.) • Management: • Landfills/water sources • Composting • Energy Production Agricultural Wastes
Industrial Wastes EPA estimates American industries generate 7.6 billion tons of industrial solid waste each year Types: Manufacturing byproducts Outdated equipment Sludge; decontamination products Management: Landfills/water sources Recycling Energy Production
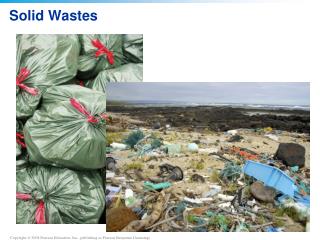
Municipal Waste • Refuse mixing -hazardous wastes with non-hazardous. • Batteries - zinc, lead or mercury • Paint • Pesticides • Plastics that produce dioxins • Loss of recyclable wastes (dumped with non-recyclable wastes).
Bad Ideas: • 1. Ocean Dumping Disposal Methods
Bad Ideas: • 2. Open Dumps – exposed refuse Disposal Methods
Bad Ideas: • 3. Exporting Waste - Garbage Imperialism (e.g., Khian Sea from Philadelphia with toxic ash) Disposal Methods Sailed 16 years, then returned to PA
Western History of Waste Management Believed that the city of Athens organized the first municipal dump in the Western world. In approximately 500 BC citizens were required to dispose of their waste at least one mile from the city walls. Ancient rubbish dumps excavated in archaeological digs reveal only tiny amounts of ash, broken tools and pottery. Everything that could be was repaired and reused, populations were smaller, and people lived in less concentrated groups.
In early pre-industrial times, waste was mainly composed of ash from fires, wood, bones, and vegetable and bodily waste. It was disposed of into the ground, where it would act as compost and help to improve the soil. In 1842, a report in England linked disease to filthy environmental conditions and launched the age of sanitation. Pre-Industrial Revolution Waste Management in England
In Nottingham in 1874, a new technology called "the destructor" provided the first systematic incineration of municipal solid waste. The Public Health Act in 1875 charged local authorities in England with the duty to arrange the removal and disposal of waste, starting the civic and local authority power over waste management. Post-Industrial Revolution Waste Management in England
Disposal Methods • Two Alternatives: • 1. Sanitary landfills
Problems and Concerns with Sanitary Landfills • 1. Number of landfills declining • 2. Methane gas • 3. Contamination of surface and ground water (must monitor) • 4. Plastics - Extremely • long life in a landfill • 5. NIMBY
2. Incineration - Space reduction and energy recovery • Mass burn - avoids sorting, but can cause air pollution because hazardous wastes are not removed. • Refuse-derived fuel - Removal of unburnable or recyclable materials before combustion. Disposal Methods
Incineration - Benefits • Incinerators drastically reduce the amount of municipal solid waste - up to 90% by volume and 75% by weight. • Incinerators can be constructed locally, thus cutting down on transportation costs. 3. Derived heat may be used for electricity generation.
Problems and Concerns with Incineration • Many of the problems existing with sanitary landfills • Air pollution - carbon monoxide, particulates, heavy metals (mercury and lead), dioxins from plastics • Slag and fly ash can be a hazardous waste - removing batteries and chlorine-based plastics can help. • NIMBY • Cost
Shrinking the Waste Stream – Source Reduction • Since 2 liter soft drink bottle was introduced in 1977, weight has been reduced by 35%. • Since 1965, aluminum cans • have been reduced in • weight by 35%.
Shrinking the Waste Stream - Recycling • Benefits: • Fewer landfill/Incineration issues • Fewer raw resources needed • Less pollution • Economics • Constraints: • Fluctuating market price • Diverse Plastics • Lack of Deposit Fees • Lack of Incentives: recycled plastics more costly
Tire Recycling Americans dispose of approximately 278 million tires/year, more than one for every man, woman and child. Are approximately 3 billion tires stockpiled. Mosquitoes and disease may arise from stockpiles. Pollution
Tire Recycling – Possible Uses Rubberized asphalt concrete (RAC) - Caltrans began use of rubberized asphalt concrete in 1980. Between 1980 and 1998, Caltrans used a total of 2,458,930 tons of RAC. Based upon the formula developed by the Rubber Pavements Association, this translates to the use of 4.5 million discarded tires. Whole tires may be used in artificial breakwaters and reefs.
Tire Recycling – Possible Uses Chips, crumble, and shreds of tires currently have limited markets (e.g., playground surfaces) Shredded tires may be used as lightweight fill in civil engineering applications, and they can replace other conventional lightweight fill such as expanded foam. The benefits of using tire chips instead of conventional construction materials include: reduced density, improved drainage properties and better thermal insulation.
Tire Recycling – Possible Uses As as energy source (long payback period, requires ongoing stockpiles, burns hot, emission issues). On average, the BTU value of scrap tires or TDF (tire-derived fuel) exceeds that of coal, while the sulfur content is in the same order of magnitude or even lower. Cement kilns are by far the largest users of TDF. Some cement companies have the capacity to incinerate whole tires, thus being able to omit the comparatively expensive size reduction process.
Means of Disposal EU USA Tire Derived Fuel (TDF) 508,500 22% 950,000 40% Landfilling 1,017,100 46% 920,000 38% Civil Engineering 228,900 10% 225,000 9% Rubber Recycling 228,800 10% 180,000 7% Export and Miscellaneous 279,700 12% 135,000 6% Total: 2,263,000 2,410,000 Table 1: Scrap Tire Disposal in EU Member States and the U.S. in 1999. All figures are in metric tons, percentage figures are rounded. Sources: Recycling Research Institute, European Tyre Recycling Association (ETRA).
Recycling Benefits Resource Conservation (e.g., One Sunday edition of N.Y. Times consumes 62,000 trees.) Pollution Reduction Energy Conservation (e.g., Crushed glass reduces the energy required to manufacture new glass by 50%.)
Data Accuracy Raven and Berg Textbook Alum. = 66% Paper = 40% Glass = 36% Plastics <20%