Download
1 / 55
730 likes | 1.73k Views
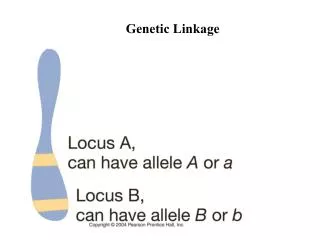
Chapter 4 Gene Linkage and Genetic Mapping. Important Definitions. Locus = physical location of a gene on a chromosome Homologous pairs of chromosomes often contain alternative forms of a given gene = alleles Different alleles of the same gene segregate at Meiosis I

E N D
Chapter 4 Gene Linkage and Genetic Mapping
Important Definitions • Locus = physical location of a gene on a chromosome • Homologous pairs of chromosomes often contain alternative forms of a given gene = alleles • Different alleles of the same gene segregate at Meiosis I • Alleles of different genes assort independently in gametes • Genes on the same chromosome exhibit linkage: inherited together
Genetic Mapping • Gene mapping determines the order of genes and the relative distances between them in map units • 1 map unit= 1 cM (centimorgan) In double heterozyote: • Cisconfiguration = mutant alleles of both genes are on the same chromosome = ab/AB • Trans configuration = mutant alleles are on different homologues of the same chromosome = Ab/aB
Genetic Mapping • Gene mapping methods use recombination frequencies between alleles in order to determine the relative distances between them • Recombination frequencies between genes are inversely proportional to their distance apart • Distance measurement: 1 map unit = 1 percent recombination (true for short distances)
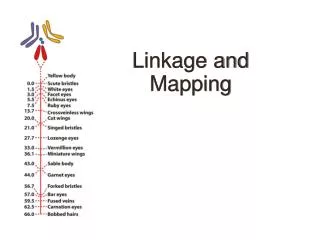
Genetic Mapping • Recombination results from crossing-over between linked alleles • The linkage of the genes can be represented as a genetic map, which shows the linear order of the genes along the chromosome spaced so that the distances between genes is proportional to the frequency of recombination between them.
Genetic Map Figure 4.5: The frequency of recombination is used to construct a genetic map
Genetic Mapping • Genes with recombination frequencies less than 50 percent are on the same chromosome = linked • Linkage group = all known genes on a chromosome • Two genes that undergo independent assortment have recombination frequency of 50 percent and are located on nonhomologous chromosomes or far apart on the same chromosome = unlinked
Recombination • Recombination between linked genes occurs at the same frequency whether alleles are in cisortransconfiguration • Recombination frequency is specific for a particular pair of genes • Recombination frequency increases with increasing distances between genes • No matter how far apart two genes may be, the maximum frequency of recombination between any two genes is 50 percent.
Genetic Mapping • Recombination changes the allelic arrangement on homologous chromosomes Figure 4.4: Crossing-over between two genes
Genetic Mapping • The map distance (cM) between two genesequals one half the average number of crossovers in that region per meiotic cell • Therecombination frequency between two genes indicates how much recombination is actually observed in a particular experiment; it is a measure of recombination
Figure 4.6: Diagram of chromosomal configurations in 50 meiotic cells
Genetic Mapping • Over an interval so short that multiple crossovers are precluded (~ 10 percent recombination or less), the map distance equals the recombination frequency because all crossovers result in recombinant gametes. • Over the short interval genetic map=linkage map=chromosome map
Genetic Mapping • The frequency of recombination between two mutant alleles is independent of whether they are present in the same chromosome or in homologous chromosomes.
Figure 4.2: The frequency of recombination between two mutant alleles
Gene Mapping: Double Crossing Over • Two exchanges taking place between genes, and both involving the same pair of chromatids, result in nonrecombinant chromosomes Figure 4.8: Crossovers between marker genes A and B
Figure 4.12: The result of two crossovers in the interval between two genes is indistinguishable from independent assortment of the genes
Genetic vs. Physical Distance • Map distances based on recombination frequencies are not a direct measurement of physical distance along a chromosome • Recombination “hot spots” overestimate physical length • Low rates in heterochromatin and centromeres underestimate actual physical length
Figure 4.11: Chromosome 2 in Drosophila as it appears in metaphase of mitosis and in the genetic map
Genetic Mapping: Three-Point Cross • In any genetic cross, the two most frequent types of gametes are nonrecombinant; these provide the linkage phase (cis versus trans) of the alleles in the multiply heterozygous parent. • The two rarest classes identify the double-recombinant gametes. • The effect of double crossing-over is exchange of members of the middle pair of alleles between the chromosomes
Genetic Mapping • Mapping function: the relation between genetic map distance and the frequency of recombination • Chromosome interference: crossovers in one region decrease the probability of a second crossover close by Figure 4.17: Mapping functions
Genetic Mapping • Coefficient of coincidence= observed number of double recombinants divided by the expected number • Interference = 1-coefficient of coincidence
Mapping Genes in Human Pedigrees • Methods of recombinant DNA technology are used to map human chromosomes and locate genes • Genes can then be cloned to determine structure and function • Human pedigrees and DNA mapping are used to identify dominant and recessive disease genes • PolymorphicDNA sequences are used in human genetic mapping.
Mapping Genes in Human Pedigrees • Most genes that cause genetic diseases are rare, so they are observed in only a small number of families. • Many mutant genes of interest in human genetics are recessive, so they are not detected in heterozygous genotypes. • The number of offspring per human family is relatively small, so segregation cannot usually be detected in single sibships. • The human geneticist cannot perform testcrosses or backcrosses, because human matings are not dictated by an experimenter.
Genetic Polymorphisms • The presence in a population of two or more relatively common forms of a gene or a chromosome is calledpolymorphism • A prevalent type of polymorphism is a single base pair difference, simple-nucleotide polymorphism (SNP) • SNPs in restriction sites yield restriction fragment length polymorphism (RFLP) • Polymorphism resulting from a tandemly repeated short DNA sequence is called a simple sequence repeat(SSR)
SNPs • SNPs are abundant in the human genome. • The density of SNPs in the human genome averages about one per 1300 bp • Identifying the particular nucleotide present at each of a million SNPs is made possible through the use of DNA microarrays composed of about 20 million infinitesimal spots on a glass slide the size of a postage stamp.
RFLPs • Restriction endonucleases are used to map genes as they produce a unique set of fragments for a gene • There are more than 200 restriction endonucleases in use, and each recognizes a specific sequence of DNA bases • EcoR1cuts double-stranded DNA at the sequence 5'-GAATTC-3' wherever it occurs
Figure 4.19: The restriction enzyme EcoRI cleaves double-stranded DNA wherever the sequence 5-GAATTC-3 is present
RFLPs • Differences in DNA sequence generate different DNA cleavage sites for specific restriction enzymes • Two different alleles will produce different fragment patterns when cut with the same restriction enzyme due to differences in DNA sequence Figure 4.20: A minor difference in the DNA sequence of two molecules can be detected if the difference eliminates a restriction site
SSRs • A third type of DNA polymorphism results from differences in the number of copies of a short DNA sequence that may be repeated many times in tandem at a particular site in a chromosome • When a DNA molecule is cleaved with a restriction endonuclease that cleaves at sites flanking the tandem repeat, the size of the DNA fragment produced is determined by the number of repeats present in the molecule • There is an average of one SSR per 2 kb of human DNA
Figure 4.21B: A type of genetic variation that is widespread in most natural populations of animals and plants
Mapping Genes in Human Pedigrees • Human pedigrees can be analyzed for the inheritance pattern of different alleles of a gene based on differences in SSRs and SNPs • Restriction enzyme cleavage of polymorphic alleles that are different in RFLP pattern produces different size fragments by gel electrophoresis
Figure 4.22: Human pedigree showing segregation of SSR alleles
Copy-number polymorphisms (CNPs) • A substantial portion of the human genome can be duplicated or deleted in much larger but still submicroscopic chunks ranging from 1 kb to 1 Mb. • This type of variation is known as copy-number polymorphism (CNP). • The extra or missing copies of the genome in CNPs can be detected by means of hybridization with oligonucleotides in DNA microarrays.
Tetrad Analysis • In some species of fungi, each meiotic tetrad is contained in a sac-like structure, called an ascus • Each product of meiosis is an ascospore, and all of the ascospores formed from one meiotic cell remain together in the ascus Figure 4.23: Formation of an ascus containing all of the four products of a single meiosis
Tetrad Analysis • Several features of ascus-producing organisms are especially useful for genetic analysis: • They are haploid, so the genotype is expressed directly in the phenotype • They produce very large numbers of progeny • Their life cycles tend to be short
Ordered and Unordered Tetrads • Organisms like Saccharomycescerevisiae, produce unordered tetrads: the meiotic products are not arranged in any particular order in the ascus • Unordered tetrads have no relation to the geometry of meiosis. • Bread molds of the genus Neurospora have the meiotic products arranged in a definite order directly related to the planes of the meiotic divisions—ordered tetrads • The geometry of meiosis is revealed in ordered tetrads
Tetrad Analysis: Unordered Tetrads • In tetrads when two pairs of alleles are segregating, three patterns of segregation are possible • Parental ditype (PD) = two parental genotypes • Nonparental ditype (NPD) = only recombinant combinations • Tetratype (TT) = all four genotypes observed Figure 4.25: Types of unordered asci produced with two genes in different chromosomes
Tetrad Analysis: Unordered Tetrads • The existence of TT for linked genes demonstrates two important features of crossing-over: • The exchange of segments between parental chromatids takes place in prophase I, after the chromosomes have duplicated • The exchange process consists of the breaking and rejoining of the two chromatids, resulting in the reciprocal exchange of equal and corresponding segments
Tetrad Analysis • When genes are unlinked, the parental ditype tetrads and the nonparental ditype tetrads are expected in equal frequencies: PD = NPD • Linkage is indicated when nonparental ditype tetrads appear with a much lower frequency than parental ditype tetrads: PD » NPD • Map distance between two genes that are sufficiently close that double and higher levels of crossing-over can be neglected, equals 1/2 x (number TT / total number of tetrads) x 100
Tetrad Analysis: Ordered Tetrads • Ordered asci also can be classified as PD, NPD, or TT with respect to two pairs of alleles, which makes it possible to assess the degree of linkage between the genes • The fact that the arrangement of meiotic products is ordered also makes it possible to determine the recombination frequency between any particular gene and its centromere
Tetrad Analysis: Ordered Tetrads • Homologous centromeres of parental chromosomes separate at the first meiotic division • The centromeres of sister chromatids separate at the second meiotic division • When there is no crossover between the gene and centromere, the alleles segregate in meiosis I • A crossover between the gene and the centromere delays segregation alleles until meiosis II
Tetrad Analysis: Ordered Tetrads • The map distance between the gene and its centromere equals: 1/2 x (number of asci with second division segregation/total number of asci) x 100 • This formula is valid when the gene is close enough to the centromere and there are no multiple crossovers
Figure 4.28 (top): First- and second-division segregation in Neurospora
Figure 4.28 (bottom): First- and second-division segregation in Neurospora
Gene Conversion • Most asci from heterozygous Aa diploids demonstrate normal Mendelian segregation and contain ratios of 2A : 2a in four-spored asci, or 4A : 4ain eight-spored asci. • Occasionally, aberrant ratios are also found, such as 3A : 1a or 1A : 3a and 5A : 3a or 3A : 5a. • The aberrant asci are said to result from gene conversion because it appears as if one allele has “converted” the other allele into a form like itself
Gene Conversion • Gene conversion is frequently accompanied by recombination between genetic markers on either side of the conversion event, even when the flanking markers are tightly linked • Gene conversion results from a normal DNA repair process in the cell known as mismatch repair • Gene conversion suggests a molecular mechanism of recombination