Download
1 / 24
240 likes | 350 Views
Tasks in Calculus: Results of a 9-Year Evolution. Geneviève Savard and Kathleen Pineau École de technologie supérieure Montréal, Canada. @ École de technologie supérieure. All teachers and students have the same calculator and textbook and there is a common final exam 1999 TI-92 Plus

E N D
Tasks in Calculus: Results of a 9-Year Evolution Geneviève Savard and Kathleen PineauÉcole de technologie supérieureMontréal, Canada
@ École de technologie supérieure All teachers and students have the same calculator and textbook and there is a common final exam • 1999 • TI-92 Plus • Harvard group text Calculus: Single Variable • 2004 • Voyage 200 • Stewart’s Calculus, Concepts and Contexts • 2006 • Voyage 200 • Home grown text
Problem solving ? Read and understandthe problem Translate to sketches, graphs, tables, ... Establish a plan Intermediate information? Strategy? Necessary tools? Execute the plan Calculate, solve equations, apply algorithms,… Examine the solution Validate result Interpret result in context Present solutionwith relevant information concerning the solving process
? Problem solving Read and understandthe problem Translate to sketches, graphs, tables, ... Establish a plan Intermediate information? Strategy? Necessary tools? Execute the plan Calculate, solve equations, apply algorithms,… Examine the solution Validate result Interpret result in context Present solutionwith relevant information concerning the solving process
? Problem solving Read and understandthe problem Translate to sketches, graphs, tables, ... Establish a plan Intermediate information? Strategy? Necessary tools? Execute the plan Calculate, solve equations, apply algorithms,… Examine the solution Validate result Interpret result in context Present solutionwith relevant information concerning the solving process
A classic… Find the equation of the line tangent to the graph of at the point where Why?
? Ex1: answering the question Why? piece support Equation of the parabola Contact points between the conical support and the piece must be at x=5 and x= -5. • Angle? • Height of the cone? Objective: create the need for the mathematical tool 2D cross-section Graded Class work Fall 2004, Textbook 2006
Ex1: Hands-on piece support Determine the dimensions of the cone (height, apothem and radius of base). Build one with cardboard. New opportunity for validation Consolidation of geometrical notions Preparation for optimisation problem 2D cross-section New ideas...
Ex2: Evaluating understanding At 13:00, a rainwater tank contains 500 litres of water. The rainwater is filling the tank at a rate of where t is measured in hours from 13:00. • Calculate the area under the curve y=Q(t) for t ranging from 1 to 3. What does this value represent in this context? • What will be the volume of water in the tank at 3:00 pm? Explain your reasoning. • If the tank can only contain 1 250 litres of water, will it overflow? If so, at what time? Explain your reasoning. If it does not overflow, explain why in the context of our problem. • What expression containing a definite integral makes it possible to calculate the average flow rate between 13:00 and 15:00? Calculate this average flow rate and interpret what it represents on the graph of y=Q(t). A lot of sub- questions Final exam, summer 2006
? Ex2: Starting with basics At 13:00, a rainwater tank contains 500 litres of water. The rainwater is filling the tank at a rate of where t is measured in hours from 13:00. • Calculate the area under the curve y=Q(t) for t ranging from 1 to 3. What does this value represent in this context? Answer... Represents the quantity of water (410.5 L) that was added to the tank between 2 and 4 pm. Easy • Not so easy • Units, area linked to litres !!! • Frame of reference Final exam, summer 2006
? Ex2: Guiding students At 13:00, a rainwater tank contains 500 litres of water. The rainwater is filling the tank at a rate of where t is measured in hours from 13:00. • What will be the volume of water in the tank at 3:00 pm? Explain your reasoning. Answer... Initial quantity plus change... Purpose: setting up c) Final exam, summer 2006
? Ex2: Making sense of notation • If the tank can only contain 1 250 litres of water, will it overflow? If so, at what time? Explain your reasoning.If it does not overflow, explain why in the context of our problem. Answer... There will be overflow at approximately 4:30 pm. Difficult concept: variable upper limit Final exam, summer 2006
Ex2: Changing registers • What expression containing a definite integral makes it possible to calculate the average flow rate between 13:00 and 15:00? Calculate this rate and interpret what it represents on the graph of y=Q(t). Answer... The area under the curve is the same as that of the rectangle Final exam, summer 2006
Ex3: Working with graphs Let f(t) be the function graphed below. • Evaluate g(12), g’(12), and g’’(12).Show how you go about getting your answer. Define Quiz, fall 2007- TI prohibited !
Ex3: Adding context • Suppose that f(t) represents the flow of liquid entering or exiting a tank in L/min at time t. Suppose also that the initial volume of liquid in the tank is 60 litres. What are the minimum and maximum volume of liquid contained in the tank during the first 12 minutes? ? Quiz, fall 2007- TI prohibited !
? Ex3: Creating expertise • In this context, what is the average flow rate for the first 12 minutes? Quiz, fall 2007- TI prohibited !
Variations on the same theme • CAS is technically unnecessary. However, it offers (in the teaching/learning process) the possibility of switching easily from one register to another. • Validation of results facilitated by working with different registers (constructing an expertise regarding what is useful about a particular register) Ex2 with symbolic register Students guided with questions Emphasis on contextual interpretation: units, frame of reference, ... Ex3 with graphical register Students unguided, they choose the tools Emphasis on graphical interpretation
Ex4: Using CAS The maximum level of liquid contained in a tank is 1.6 m. The tank’s shape is obtained by revolving around the y axis the region bounded by the curves where x and y are measured in metres. Your job is to evaluate the height of the liquid when the tank is half full. Graded homework, fall 2007
a) Illustrate the problem: 2D cross section and 3D outline showing important values ? ? A change in register is necessary Graded homework, fall 2007
a) Illustrate the problem: 2D cross section and 3D outline showing important values continued Graded homework, fall 2007
b) What is the maximum volume of liquid contained in the tank? ? Disk method Students compare with the volume of a cone or a cylinder or... Maximum volume is 33.90 m3. Graded homework, fall 2007
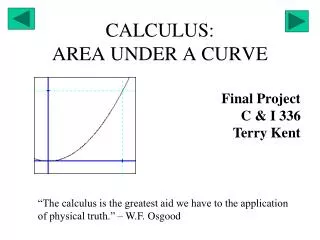
Graph volume function with respect to height of liquid. • From this graph, estimate the height of the liquid when the tank is half full. ? 33.90 v v(h) 16.95 h 0.5
e) Refine your estimate using the calculator Judicious use of solver Numerical validation: v(1.29765) = v(1.6) / 2 Common sense validation: using the shape of the tank, the height of the liquid when the tank is half full should be more than 0.8 m (half the height of the tank.) Graded homework, fall 2007
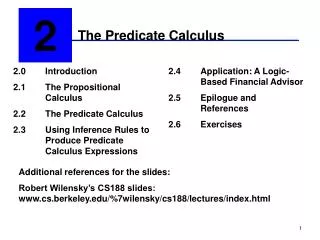
? ? Conclusions • More emphasis on • Context • Interpretation of results (mathematical and contextual) • Validation (facilitated by work in different registers) • Our intentions... • Make (through the “imagery” of contexts) the mathematical notations easier to understand and to piece together • Create the need for mathematical tools in the student, thereby acting on motivation and ability to choose the appropriate tool • Generate a need for interpretation (that could lead to one of validation) • Work on communication skills • Read and interpret a varied set of problems • Choose arguments • Write in natural language interpretation of results • Develop mathematical control over the use of the tool