Download
1 / 19
690 likes | 2.57k Views
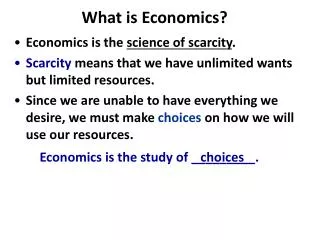
What is Economics?. Economics is the science of scarcity . Scarcity means that we have unlimited wants but limited resources . Since we are unable to have everything we desire, we must make choices on how we will use our resources. . Economics is the study of _________. choices.

E N D
What is Economics? • Economics is the science of scarcity. • Scarcity means that we have unlimited wants but limited resources. • Since we are unable to have everything we desire, we must make choices on how we will use our resources. Economics is the study of _________. choices
Examples: • You must choose between buying jeans or buying shoes. • Businesses must choose how many people to hire • Governments must choose how much to spend on welfare. Textbook Definition Economics- Social science concerned with the efficient use of scarce resources to achieve maximum satisfaction of economic wants. Study of how individuals and societies deal with _______ scarcity
5 Key Economic Assumptions • Society’s wants are unlimited, but ALL resources are limited (scarcity). • Due to scarcity, choices must be made. Every choice has a cost (a trade-off). • Everyone’s goal is to make choices that maximize their satisfaction. Everyone acts in their own “self-interest.” People are rational. • Everyone makes decisions by comparing the marginal costs and marginal benefits of every choice. • Real-life situations can be explained and analyzed through simplified models and graphs.
Is this person’s decision rational? http://www.humoroftheday.com/gallery/images/Pierced1.jpg
Thinking at the Margin Would you see the movie three times? Notice that the total benefit is more than the total cost but you would NOT watch the movie the 3rd time.
Economic SystemsSee Handout Centrally-Planned (Command) Economy Free Market Economy Mixed Economy Traditional (subsistance)
Economic system must answer three economic questions What to produce How to produce it Who gets it
Production Possibilities How does the PPG graphically demonstrates scarcity, trade-offs, opportunity costs, and efficiency? 14 12 10 8 6 4 2 0 Impossible/Unattainable (given current resources) A B G C Bikes Efficient D Inefficient/ Unemployment E 0 2 4 6 8 10 Computers
DEMAND DEFINED • What is Demand? • Demand is the different quantities of goods that consumers are willing and able to buy at different prices. • (Ex: Bill Gates is able to purchase a Ferrari, but if he isn’t willing he has NO demand for one) • What is the Law of Demand? • There is an INVERSE relationship between price and quantity demanded
LAW OF DEMAND As Price Falls… …Quantity Demanded Rises As Price Rises… …Quantity Demanded Falls Quantity Demanded Price
The Demand Curve • A demand curve is a graphical representation of a demand schedule. • The demand curve is downward sloping showing the inverse relationship between price (on the y-axis) and quantity demanded (on the x-axis) • When reading a demand curve, assume all outside factors, such as income, are held constant. (This is called ceteris paribus) Let’s draw a demand curve for cereal…
GRAPHING DEMAND Demand Schedule Price of Cereal $5 4 3 2 1 Demand o Q 10 20 30 40 50 60 70 80 Quantity of Cereal 14
Supply Defined • What is supply? • Supply is the different quantities of a good that sellers are willing and able to sell (produce) at different prices. • What is the Law of Supply? • There is a DIRECT (or positive) relationship between price and quantity supplied. • As price increases, the quantity producers make increases • As price falls, the quantity producers make falls. • Why? Because, at higher prices profit seeking firms have an incentive to produce more.
GRAPHING SUPPLY Supply Schedule Price of Cereal Supply $5 4 3 2 1 o Q 10 20 30 40 50 60 70 80 Quantity of Cereal 16
Supply and Demand are put together to determine equilibrium price and equilibrium quantity P Supply Schedule Demand Schedule S $5 4 3 2 1 Equilibrium Price = $3 (Qd=Qs) D o Q 10 20 30 40 50 60 70 80 Equilibrium Quantity is 30 17
The study of how people earn their living, how livelihood systems vary by area, and how economic activities are spatially interrelated and linked. Economic Geography
Unit 6 Project • Economies of Scale • Weber • Hotelling • Losch • Ford
Location • Fixed or Variable cost • Footloose