Download
1 / 13
170 likes | 1.05k Views
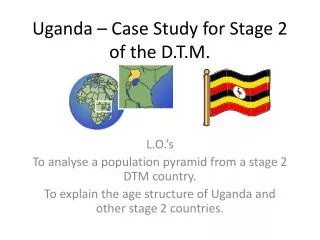
Uganda – Case Study for Stage 2 of the D.T.M. L.O.’s To analyse a population pyramid from a stage 2 DTM country. To explain the age structure of Uganda and other stage 2 countries. The Demographic Transition Model. Uganda’s Population Pyramid – Stage 2 DTM – Early Expanding.

E N D
Uganda – Case Study for Stage 2 of the D.T.M. L.O.’s To analyse a population pyramid from a stage 2 DTM country. To explain the age structure of Uganda and other stage 2 countries.
Skills!! – Population Pyramids • A population pyramid is an example of a Divergent Bar Graph with data spread either side of the y axis. Useful for interpreting population data: • the number or % of people in each age group • Comparing age groups • Whether BR are falling or rising • Whether Infant Mortality is high or low (by comparing 0-4 age group with the 5-9 age group) • Whether life expectancy is low or high
Uganda Fact File • Uganda’s population of 33.4 million it is mainly a rural society. • It has one of the world’s most youthful populations - 50% are aged under 15 (16.7mil) • The median age is 15. The population is doubling every 19 years! • Uganda’s GDP per capita is $1300 it is a LDC, the average rural family earns £200 (the UK’s GDP is $35,200 per capita). • The main exports are coffee, tobacco, sugar cane and tea as there are fertile soils. • Uganda also has HEP and important reserves of metal ores e.g. Iron and Tantalite (used in electronics – mobile phones) • However because most exports are primary products the world prices vary so the government’s tax income also varies. Few large companies or individuals exist to tax, so spending on education and health care is low. • BR is 47.5 per 1000 (high), the Fertility Rate is 6.7 children per women and girls marry as young as 13 or 14 in rural areas. Girls are an economic asset for their families as they attract a marriage dowry. • DR is 11.9 per1000 (low) because of UNICEF’s global programme provides vaccinations against common killer diseases. Treatments for diarrhoea and malaria are also provided to some. Life Expectancy and Healthcare • In the last 20 years Infant mortality rates have halved but at 63.7 per 1000 this is still very high. • Life expectancy in 2010 was 53 years (UK =79). • The AIDS epidemic in Sub Saharan Africa is partly responsible for the low life expectancy – 20% were HIV in the 1990’s. But with education programmes this has dropped now to 5.4%. • 24% of Ugandan families are undernourished. • Several diseases still cause premature death e.g. Malaria, Typhoid and Cholera. • Only 64% of Ugandans have access to safe water and 43% to a sewerage system.
Uganda Fact File cont. Education • Primary education is universal and free. Secondary school is mainly privately run and school fees cost approx £20 per term. Only 17% of girls attend secondary schools beyond the age of 13 – families spend their limited money educating their sons. • There are 4 government universities and places are shared out per district so you have a 1 in 30,000 chance. • In rural areas women rarely own land in Uganda and usually work as labourers when work is available. Few have careers. Maternal mortality rates are high as 80% of babies are born without skilled midwives/ healthworkers in attendance. Most give birth at home. • However in the capital city, Kampala, educated women have careers, choose their partners, marry later and have fewer children with fertility rates as low as in MDC’s. Things are changing: • Uganda is a HIPC (Highly Indebted Poor Country) and has qualified for debt cancellation by the G8 in 2000 and 2005. • Conditions were imposed that the money saved had to be spent on poverty reduction, healthcare and education. • Healthcare spending has risen by 70% including the abolition of fees for basic healthcare. • Education spending has risen by 40% before this there were 20% fewer girls than boys in primary school. • 2.2 million extra people now have access to clean water – fetching water is traditional a girls responsibility so this has freed more girls up to go to school.
Describing Age Structure Describe the shape of the pyramid: Is it convex or concave? 3. The 60+ age group:- this tells us about life expectancy, healthcare and death rates. They are also dependent. We divide a population pyramid into 3 main groups: 1. Under 15’s – this tells us about BR, IM, DR. They are part of the dependent population 2. The 15-59 age group are the main working population and tax payers. A steep gradient shows a high DR in this age group.
Your mission should you choose to accept it! • Describe the age structure of Uganda. • Explain the features of Uganda’s age structure. Success Criteria: • Use GKW’s: BR, DR, NI, Fertility rates, Dependency Ratio, Life Expectancy, DTM etc. • Quote data from your graph or table. • Use the data (calculate NI etc.) • Use case study information from the fact file in your explanations • Annotate your descriptions and explanations around you population pyramid with arrows pointing to the part of the pyramid you are referring to.