Download
1 / 98
990 likes | 1.12k Views
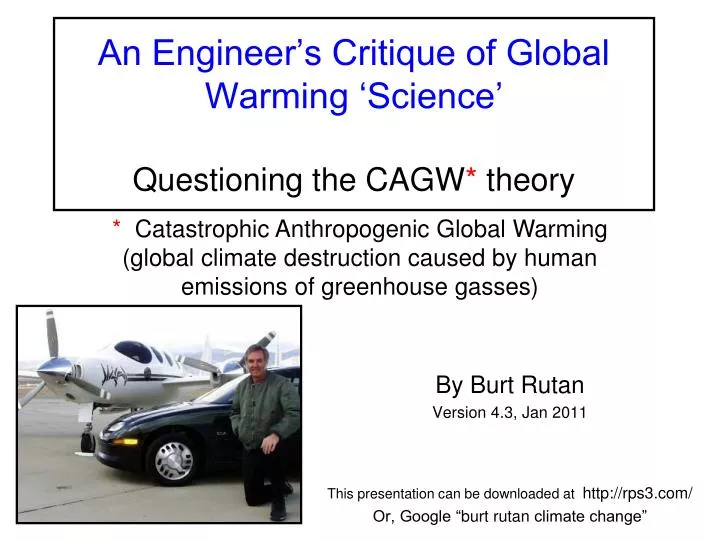
An Engineer’s Critique of Global Warming ‘Science’ Questioning the CAGW * theory. * Catastrophic Anthropogenic Global Warming (global climate destruction caused by human emissions of greenhouse gasses). By Burt Rutan Version 4.3, Jan 2011

E N D
An Engineer’s Critique of Global Warming ‘Science’Questioning the CAGW* theory * Catastrophic Anthropogenic Global Warming (global climate destruction caused by human emissions of greenhouse gasses) By Burt Rutan Version 4.3, Jan 2011 This presentation can be downloaded at http://rps3.com/ Or, Google “burtrutan climate change”
Our CO2-starved Atmosphere Note, the green life along the Nile river and the dead desert elsewhere. When co2 is greater in the atmosphere, plants need less water to thrive. When dinosaurs roamed we had 3 to 5 times current co2 and planet was nearly all green, pole-to-pole Near catastrophe when co2 declined to 180 ppm, since below 150 ppm plants, then animals die. If you promote a green healthy planet, then you should lobby for a co2-fertilized atmosphere, not a co2-starved atmosphere.
My Introduction to the Global Warming Scare United Nations Intergovernmental Panel on Climate Change This chart includes a large number of next-century predictions - all of them showing either big problems or catastrophe in the next century; all caused by a theory of CO2 greenhouse gas heating from human emissions (AGW). Is there something an engineer can do to solve this problem? Red Circle is the claimed CAGW scare
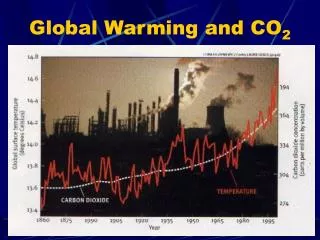
What Happened between 1990 and 2001? IPCC 2001 report The ‘hockey stick’ data presentation shown here is no longer used, even by the UN, since it has been shown to be fraudulent. Red Circle is the claimed AGW scare Players in the CAGW issue: Government Scientists, Universities, Politicians, Top Leadership, Science Media, etc. But…. No engineers or engineering studies/programs are being evaluated for the IPCC Reports. IPCC 1990 report Current temperature
The significance of “Statistical Significance”. This Chart shows five “trends”, all ending at CY 2000: A - 16,000 years, includes recovery from ice age. B - 10,000 years, the current “stable warm period”. C - 2,000 years, the Christian Era. D - 700 years, the Little Ice Age (LIA) cycle. E - 100 years, recovery from LIA. All 5 trends except E are Statistical Significant. However, trend E is what the Alarmists focus on, to ‘prove’ the correlation with human emissions. Data from GISP2 ice cores (after NSIDC User Services 1997 and Davis/Bohling, 2001.
An Engineering look at Man-Caused Global Warming • Not a Climatologist’s analysis - a view from a flight test engineer who has spent 45 years doing data analysis/interpretation/presentation. • A focus on how the scientific community has handled the ‘global warming due to fossil fuel burning’ theory. • A review of the climate data, then a study on how the results are selected, presented and promoted. • The focus is on an Engineering Approach – where data are critical and there are consequences for being wrong; not the Scientist approach – where a theory is the product and it can be right or wrong without repercussions. • A presentation of climate data the way an engineer would show it – present all the data, then do analysis without bias to any proposed theory.
Modern Human-Extinction Scares • Population Bomb, starvation/crowding - 1940s to 1970s • Silent Spring, DDT - 1960s & 1970s (outlawing DDT killed millions) • Global Nuclear War - 1950s thru 1980s • Global cooling, Ice Age/starvation - 1956 to 1977 • Hole in the Ozone layer, caused by CFCs, 1970s & 1980s (We now know that the Ozone changes were not caused by human CFCs) • Nuclear Winter, nuke-caused ice Age - 1980s & 1990s • Asteroid Impact - 1930 to present (a real, but remote risk) • Global Warming - 1929 to 1969 and 1987 to 2003 • “Climate Change” - 2003 to present Is ‘Climate Change’ just another over-blown scare?
Solar Hot Water in the 70s. Now building a 34-acre PV solar energy farm. My Desert Pyramid House “Ultimate energy-efficient house” (Pop Sci Nov 1989) Primary car was zero-emissions EV-1, 1997 to 2004. Loss of my EV-1 Electric car in 2004. General Motors crushed them all Rutan Background Includes Energy Efficiency
The Difference The Engineer vs. the Scientist • Engineering Organization • Development of a product, usually under strict certification rules. • Responsible for the product’s worth and safety. • Selling the product’s adequacy to Management • Consequences if wrong (people die). • Scientific Method • Origin of new Theories (hypothesis). • Strict process (The Scientific Method) to gain (or lose) confidence in the Theory. • Not responsible for adequacy or value of product. • Frequently being wrong is not a problem.
The Challenge is Massive for the Alarmist To track and to forecast miniscule global-average temperature changes. The temperature trend is so slight that, were the global average temperaturechange which has taken place during the 20th and 21st centuries were to occur in an ordinary room, most of the people in the room would be unaware of it. The CO2 % in this room will increase more during this talk than the atmospheric CO2 % did in the last 100 years.
The CAGW call to action (for a Carbon-constrained world).Requires these 5 issues to be true.This report studies these five, in order. • Recent human burning of fossil fuels suddenly and dangerously increased CO2 beyond previous levels. • Human CO2 emissions causes greenhouse warming. • Dangerous, sudden global warming occurred the last 50 years. • The current Temperature is too Hot & further warming is Bad. • It is more difficult to adapt to climate changes than to attempt to control them. First, let’s address #1. Has our use of fossil fuels caused sudden, dangerous, unprecedented CO2 increase?
The Challenge is Massive for the Alarmist - to prove his CO2 CAGW theory He must convince us that CO2 is a pollutant. But calling it a pollutant is an uninformed joke. CO2, along with oxygen and water is essential for all life. Look at a leaf, a grain, a flower. Half of what you see was made from CO2. Human’s emissions of CO2 each year = 1 tablespoon in 300 gallons. So, take a tablespoon (360 drops) of warm water, slowly drip it into a 300-gallon drum of water (6 barrels) over one year at 1 drop every day.
The Massive Alarmist’s Challenge Carbon Dioxide content is very small, invisible on a bar chart. Greenhouse gas effects of Human Emissions are also miniscule Man’s emissions of CO2 contribute only 0.117% of the total greenhouse gas warming effect.
Looking back 600 million years Atmospheric Carbon Dioxide was likely 18 times today’s concentration, during the Cambrian period when life’s diversity was at its greatest expansion (red circle). It was 4 times the current level when the dinosaurs were killed by an asteroid. The only other extended time CO2 was low, (like today) was a period 300 million years ago. In the big picture we are now in a low CO2 period. The 20th century increase shows as an insignificant dot at this scale. Do we risk runaway greenhouse warming if our CO2 concentration gets too high? CO2 has been scarce the last 2 million years. Also, it has never significantly driven temperature before. Venus may have runaway greenhouse warming, but its CO2, at 96.5% is 2,500 times the level of CO2 in the earth’s atmosphere. Now
The Basic CO2 Alarmist’s Chart The claim: CO2 content is smooth and near-constant for 200 years, and then increases, due to human emissions. But - accurate CO2 direct measurements are only available for the last 50 years.
Another Scare chartThe Alarmist’ Presentation TacticFind a correlation of human emissions to something ‘really bad’. Scale the presentation to show a scare.
A Horrific scare chart The Jump to Ice core data, back 400,000 years “CO2 is highest in a million years” Note the time scale. Ice core data does not measure recent conditions.
They selected only the circled data points that supported their theory. Measured Atmospheric CO2 Manipulation of measured data for 200 years Bluecurve is the modern, accurate data, measured at Mauna Loa Observatory, Hawaii. Greendashed curve is a fairing for all direct CO2 measurements, back to 1810.
Another CO2 Measurement Method Chemical method: data for 1810 to 1962 period.
The ‘Basic’ CO2 Chart Now takes on a different look Green dashed- Fairing of early, directly-measured CO2 Red- chemical method Blue- Mauna Loa modern measurements
Looking Back 1800 years A CO2 Measurement Proxy From stomatal density in fossil pine needles
Summary: CO2 Data for the last 1800 years Data from early & modern measurements, Ice core, chemical and pine needles. Not a lot to scare, with this chart. Is the present CO2 increase not unusual, or are pine proxies not reliable? Of course, alarmists might say the latter - until they consider the pine tree rings that brought them their most-deceptive chart of all - The hockey stick. Dashed green - early direct measurements Green - stomatal density in fossil pine needles Black - ice cores, 4 locations Red - chemical method Blue - modern, Mauna Loa direct measurements This chart informs (five data sources), but does not scare. It illustrates the significant scatter seen in the various methods for CO2 historical data. For the proper perspective this data is transferred to the next slide. 360 CO2 Concentration ~ ppm 260 1000 Year 2000
Now, to put Atmospheric CO2 in Perspective This chart is presented to Inform, not to Scare. This shows CO2 in its proper role as a trace gas, not something that has to be immediately eliminated. 0.5% Normal human CO2 limits for a confined space. OSHA Industry, submarine or ISS space station (13 times the current atmosphere). 0.4% Note: Apollo 13 LEM went to 2%, 53 times the current global atmosphere. Above 30% (780 times the current global atmosphere), CO2 causes death in humans. Note: Water Vapor (a greenhouse gas) varies up to 4.0% (100 times CO2). 0.3% CO2 - % of Atmosphere Average atmospheric CO2 content, during development of plant and animal life on earth (approximately 8 times current). Also, an ‘optimum’ level for species diversity, crop yields and tree growth. 0.2% Atmospheric Carbon Dioxide Gas, CO2 - Current CO2 0.038%. Red- Chemical measurement + Mauna Loa data. Green- from stomatal density in pine needles. Black- ice core data. Dashed- early measurements. CO2 %, indoors, in an average house 0.1% 0 0 1000 AD 2000 AD
A Pollutant? No, CO2 is critical for life Agricultural productively increased an average of 34% from 1990 to 2004. Much of that increase was due to the increase in atmospheric CO2. Plants need less water, with more CO2. A doubling of CO2 would greatly improve crop yields & forest growth. Decreasing CO2 to half the current % would be catastrophic (plants die, humans starve. A claim: About 500 million people (7% of today’s population) are alive today, who wouldn’t be, if carbon dioxide had not risen in the last century. http://www.co2science.org/subject/t/summaries/earlyspringgrowth.php
The danger is too-low atmospheric CO2 While we refer to ice ages usually as the glacial periods that have happened routinely every 100k years during the last million or 2 years, the whole of the last several million years has actually been a relative ice age. Before that, during diversity growth from sea life through dinosaurs, the planet was much warmer, with little ice at all, sea levels hundreds of feet higher and in general, GREEN from pole to pole. It was green, not dry desert because the earth was fertilized by CO2 levels 10 to 20 times present. One thing to bear in mind is that the atmospheric concentration of CO2 got down to 180 ppm during the glacial periods of the ice age the Earth is currently in (the Holocene is an interglacial in the ice age that started three million years ago). Plant growth shuts down at 150 ppm, so the earth was within 30 ppm of disaster (dry deserts and starving plant life). Terrestrial life came close to being wiped out by a lack of CO2 in the atmosphere.
#1. - Increase? Yes - Due partially to human emissions, the atmospheric content of CO2 has increased 20% in the last 50 years. CO2 might now be the highest in the human era. However, CO2 is only 0.038% of the atmosphere and CO2 is only 3.6% of all the greenhouse gasses. Dangerous increase? No, not unless it causes a dangerous result. Dangerous? yes, if it decreases 50%. CO2 is a trace gas; it has been 18 times current levels during times of life’s greatest species diversity growth. Increases are beneficial. Next is #2. Okay, so CO2 is not a problem for plants, animals and humans, but is it causing the planet to get warmer via the greenhouse effect? • Recent human burning of fossil fuels suddenly and dangerously increased CO2 beyond previous levels – Yes/No • Human CO2 emissions causes greenhouse warming. • Dangerous, sudden global warming occurred the last 50 years. • The current Temperature is too Hot &further warming is Bad. • It is more difficult to adapt to climate changes than to attempt to control them.
Assessing the Blame for Global Warming Atmospheric warming with human carbon emissions shows ‘good’ correlation only after 1970. These four uncertainties in the Climate Models swamp the warming due to doubling atmospheric CO2.
A Comparison, for the two most-recent warmings: “Natural” Global Warming vs. “CO2-caused” Global Warming. The two 30-year warming periods are nearly identical, in spite of large differences in emissions and atmospheric CO2 levels. Global temperatures cooled from 1945 to 1970, even though CO2 rose by 5%. The “Correlation With Human emissions” claim is baseless. Warming Prior to Large Human CO2 Emissions. 1915 to 1945 with 2.7% rise in CO2 Green Slope = 1.58 deg C per century Warming During Large Human CO2 Emissions. 1970 to 2000 with 13.2% rise in CO2 Green Slope = 1.63 deg C per century Data graphs from C3headlines.com
Temperature Increases Drive CO2 Rise, Not Vice Versa CO2 changes happen after temperature changes. Data basis - ice cores. This chart shows a 10,000-year period during the last ice age recovery. The temperature changes, then CO2 responds 500 to 800 years later.
The Big Greenhouse Gas Warming Effect is only for small amounts of CO2 Doubling the concentration now would have little effect on warming. The CO2 already in the atmosphere absorbs most of the light it can. The CO2 only “soaks up” its favorite wavelengths of light and it’s close to its saturation point. It can’t do much more, because there are not many left-over photons at the right wavelengths. The natural greenhouse effect is real, and it helps keep us warm, but it’s already nearly reached its peak performance. Add more CO2 and most of the extra gas is just “unemployed” molecules.
Using Computer Models to Predict Future Climate Changes Engineers and Scientists know that you cannot merely extrapolate data that are scattered due to chaotic effects. So, scientists propose a theory, model it to predict and then turn the dials to match the model to the historic data. They then use the model to predict the future. A big problem with the Scientist - he falls in love with the theory. If new data does not fit his prediction, he refuses to drop the theory, he just continues to tweak the dials. Instead, an Engineer looks for another theory, or refuses to predict - Hey, his decisions have consequences. The lesson here is one that applies to risk management “Question, Never Defend” * Note that NONE of the dozens of computer models predicted the last decade of cooling. Excuses and dial-tweaks were made after the fact. The following charts show examples of poor IPCC predictions of warming, even though they can accurately tie emissions to CO2 rise. This discredits the theory of greenhouse-gas-warming being the primary warming cause. * Rutan policy for aircraft flight safety reviews and always enforced for Flight Readiness Approvals.
Climate models fail to Predict News Media and Nature magazines often report that Global Warming is “worse than predictions”. In the vast majority of cases, they are wrong. Atmosphere Temperature Prediction Blue = prediction slope (low range) Red = actual data UN IPCC Prediction Blue = prediction range (high and low) Red = actual data
NASA’s James Hanson Calling the computer models “evidence” in Congress in 1988, Hanson predicted a leveling of warming by 2006, ONLY if drastic cuts were made in emissions. Real data - it is cooler, WITHOUT the cuts. The planet is now the same temperature as when he testified. Strangest fact - He is still invited to congress to scare the inmates. Maybe he should have been muzzled after all? Blue = prediction Red = actual data fairing Blue = prediction Red = actual data fairing
More Failed Predictions from the Computer Models Troposphere Temps, a 31 year Trend Five computer models predict greenhouse warming. Data show no support for model’s validity Blue = 2.5 deg/century slope Red = data trend Blue = model prediction, 2.2 deg/century Red = actual data Ocean heat: Opposite of prediction.
Effective Propaganda: A News Headline from June, 2010 “May, 2010 was the hottest May on record” The intended result - you now think that dangerous Global Warming is back, after the cold winter of 2009. The truth - summer heat recovery is not exceptional in the human-emissions era. Graph is for the last 130 years. Summer heat recovery extent has declined and is unchanged by human emissions.
A Generic Problem With Greenhouse Warming Models The character and distribution of the warming in the atmosphere (as measured) is dramatically different than predicted by the climate computer models. This brings the model’s assumptions into question. How can we rely on the warming predictions, if the models incorrectly predict atmosphere warming? Model predicts hot spot at 8 to 13 km for mid latitudes Models show warming rate (deg C per decade) at 4 to 14 km altitude, while measurements show rate is flat to 10km, then cool above. But, the atmosphere does not warm at 8 to 13 km altitude
Are the Greenhouse-Gas-Warming Computer Models Wrong? Climate models generally assume positive feedback Greenhouse gas warming, while some actual measurements indicate negative feedback. The measured data show negative feedback. The eleven computer models assume positive feedback. Bottom line: we really do not know for sure what the feedbacks are. The real world climate may operate opposite from the model assumptions. Thus, warming caused by emissions may be only a small fraction of the IPCC model prediction.
Greenhouse Models Cannot Predict Future Warming But, what can be used for prediction? If the engineer can find consistent, accurate, redundant data, he often extrapolates it to predict the near future. One climate data set that qualifies is the modern measurement (last 50 years) of atmospheric CO2. Data fairings on the next slide.
A Close look at Modern CO2 Measurements Accurate enough for prediction? Yes, at least on a short term. Red = South Pole Black = Mauna Loa Blue = Tutuila, American Samoa Green - Baring Head, New Zealand Orange = Alert, Canada Slope for extrapolation 1.78 ppm per year = only 0.000178% per year. 1980 2000 380 ppm Note: This is NOT a climate computer model, just an extrapolation of accurate, scatter-free, measured CO2 data. 320 ppm
The CO2 prediction. In perspective. 380 ppm 320 ppm 1980 2000 0.1% Ratio data down to a useable scale for prediction Slope = 0.000178% per year Zero 2000 One Hundred Years 2100
A Carbon Dioxide Prediction An extrapolation of the accurate modern measurements. An estimate of what might happen without Government’s taxing energy. This Chart is structured to Inform, not to Scare. 0.2% Atmospheric Carbon Dioxide Gas, CO2 - Current CO2 0.038%. Multi color – Modern measurements (last 50 years) Blue dashed line - extrapolation of modern measurements Crop yields up > 35%. Pine trees growth doubles. CO2 - % of Atmosphere 0.1% CO2 %, indoors, in an average house ? ? Oil, coal, and natural gas gets more expensive than non-CO2 emission energy, without Government taxing (approximate guess). 0 0 2100 2000 21st Century 2200 2300
Notes on continuing our use of fossil fuels • We cannot burn fossil fuels to prevent the next ice age – the greenhouse gas effect is far too weak for that. • Since our current fuels (coal, oil, natural gas) are non-renewable, as they become scarce their cost will force a change to alternatives without Government control or Tax. This market-driven change will occur earlier if Governments do not constrain use of the current fuels. • An “optimum” CO2 level for plants and animals would be reached in about 1000 years if the current rate of emissions could be continued. • We do not have enough fossil fuels to drive the atmospheric level of CO2 to anywhere close to a dangerous level. • Two more centuries of emissions like the last are not possible and not dangerous. • Using all the reserves of fossil fuels now, would have little effect on global temperatures (beyond the natural warming). • CO2 level will drop, in response to decreasing temperatures about 500 to 800 years after the planet experiences its normal 90k-year cycle – cooling into the next big ice age.
Peak Oil • Defined as being near since the 1930s • Technology always extends the prediction Most predictions of “Peak Oil” do not consider advances in technology; this one does. • Peak Lithium (for Batteries) • Demand will soon increase cost • But, technology develops alternatives. • Peak Neodymium (rare earth for motor magnets) • China already limiting exports • But, technology discovers alternatives.
1. How Much Human Energy Is Contained in One Gallon of Gas? From Dr. David Pimentel: "That is, the 38,000 kcal in one gallon of gasoline can be transformed into 8.8 KWh, which is about 3 weeks of human work equivalent. (Human work output in agriculture = 0.1 HP, or 0.074 KW, times 120 hours.)" He, of course, is accounting for the energy lost in the process of converting the gasoline into usable energy. My calculations excluding the energy lost in the conversion process are as follows: 1 Gallon of Gas = 125,000 BTUs Source: US Department of Energy 3,400 BTUs = 1 KWH Source: US Department of Energy, Bonneville Power Mgt. 1 Gallon of Gas = 37 KWH (125,000 BTUs in a gallon of gas divided by 3,400 BTUs in 1 KWH) 1 Gallon of Gas = 500 hours of human work output (37 KWH in 1 gallon of gas divided by human work output in agriculture of .074 KW = 500) 4. How Many Wind Turbines Would It Take to Replace a Single Off-Shore Drilling Platform Producing 12,000 Barrels of Oil Per Day? "Let's say that this oil was destined to be converted into electricity at an overall efficiency of 50 % (Combined Cycle Plant, no co-generation). Assuming this was decent quality oil, and not overly burdened with a high sulfur content, this oil would go to make about 10,800 bbls/day of refined products (10 % of it is used to power the refinery/transport the oil). And lets assume the oil had an average thermal content of about 140,000 Btu/gal." "Using 42 gallons/bbl and a 50 % conversion factor, 1 bbl/day could deliver about 861.2 kw-hr of electricity per day, or about 314.5 MW-hr/yr." "Where I live (New York), a single Vestas V82 wind turbine placed near the Lake Erie coastline would produce more than 5400 MW-hr/yr. This one turbine would thus be the equivalent of 17 bbls/day of oil used to make electricity. And a lot of oil is burned to make electricity in New York State, in addition to significantly more natural gas." "Thus it would take 706 Vestas V82 wind turbines to produce the same amount of electricity that could be made with your 12,000 bbl/day oil well."
Greenhouse CO2 Effectis a minor player in global warming • The important climate thermostats are too chaotic to model: • Precipitation and Cloud formation; A <2% precipitation change more than offsets a doubling of CO2, but rain and clouds are too chaotic to model, even short term. • The Pacific heat vent; observed and powerful, but cannot be modeled. It is also a stable, temperature control thermostat. • Water vapor is the primary greenhouse gas, overwhelming CO2, but even the EPA will not call water a “pollutant”. • The “clouds and humidity” factor is chaotic and bogglingly complex. High clouds tend to warm the planet but at the same time, low clouds tend to cool it. Which effect rules?
Earth orbit cycles and sunspots Are likely drivers of warming cycles Combining Ecliptic and Elliptical orbits correlates with last 60k years’ temperatures and predicts future climate. Sunspots correlate with last 1,000 years temperatures.
Where is the evidence that human emissions cause greenhouse global warming? Computer models are not evidence. There once was supporting evidence on greenhouse feedback extent. However, there are now at least three independent pieces of evidence that the temperature rises predicted by the IPCC due to CO2 emissions are exaggerated by a factor of between 2 and 10. The scientists have assumed overly-positive water vapor feedback in the climate models. Chapter 9 of IPCC latest Assessment Report 4 (2007), “Understanding and Attributing Climate Change”, contains no evidence. The claim that CO2 is the main cause of the recent global warming is an assumption, repeated numerous times. But repetition is not proof, and the scientists and policy makers’ summary report presents no actual evidence.
#2 - Emissions caused greenhouse warming? Not likely, and not supported by data. There is no evidence that carbon dioxide emissions are the main cause of the recent global warming. Our small warming/cooling cycles are mainly caused by chaotic formation of clouds/precipitation and solar input variation, not by CO2 greenhouse effects. Despite spending $billions over the last 20 years looking for evidence, the scientists have found none. In two instances they expected to find it, but in both cases they found only evidence of the opposite. Next is #3. OK, we are done with looking at CO2. Lets now look at global temperatures: did the planet indeed experience sudden, dangerous warming in the last 50 years? • Recent human burning of fossil fuels suddenly and dangerously increased CO2 beyond previous levels – Yes/No. • Human CO2 emissions causes greenhouse warming – No. • Dangerous, sudden global warming occurred the last 50 years. • The current Temperature is too Hot & further warming is Bad. • It is more difficult to adapt to climate changes than to attempt to control them.
Looking again at the UN temperature scare This chart includes a large number of predictions - all of them showing big problems or catastrophe in the next century. None of the predictions are based on reliable, tested evidence. Most of the data shown in this chart are now known to be wrong. Range of IPCC temperature predictions for the next Century. Red Circle is the claimed AGW scare
Looking Back Millions of years Now Now We are in a comparative cold period and the 20th century warming is insignificant. Runaway greenhouse destruction of our planet would have happened in the distant past (if catastrophic greenhouse theory were correct).