Download
1 / 2
20 likes | 116 Views
This research focuses on optimizing PEM fuel cell catalyst design to enhance performance and reduce cost through a detailed microstructural model that analyzes catalyst layer morphological effects.

E N D
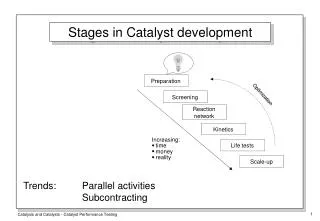
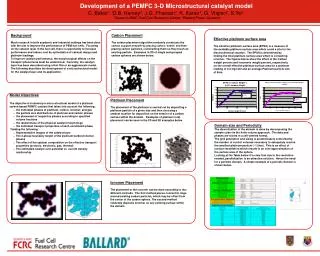
Development of a PEMFC 3-D Microstructural catalyst model C. Baker1, D.B. Harvey2, J.G. Pharoah1, K. Karan1, G. Vlajnic2, S.Ye21Queen’s-RMC Fuel Cell Research Centre, 2Ballard Power Systems Background Much research in both academic and industrial settings has been done with the aim to improve the performance of PEM fuel cells. Focusing on the catalyst layer in the fuel cell, there is opportunity to increase performance and reduce cost by optimization of catalyst design and platinum loadings. To improve catalyst performance, the morphological effects on the transport phenomena must be understood. Currently, the catalyst layer has been described using a thin film or an agglomerate model. The following describes the development of a microstructural model for the catalyst layer and its application. Carbon Placement The carbon placement algorithm randomly constructs the carbon support network by placing carbon ‘seeds’ and then placing carbon particles, constraining them so they touch an existing particle. Examples in 2D of single and grouped carbon spheres are shown below. Effective platinum surface area The effective platinum surface area (EPSA) is a measure of the available platinum surface area which could a site for the electrochemical reaction. The EPSA is determined by finding the total platinum surface area which is contacting ionomer. The figures below show the effect of the Carbon weight percent and Ionomeric weight percent, respectively, on the overall effective platinum surface area for a platinum loading of 0.4 mg/cm2 and an average Platinum particle size of 9nm. • Model Objectives • The objective is to develop a micro-structural model of a platinum carbon based PEMFC catalyst that takes into account the following: • the individual phases of platinum, carbon, ionomer, and gas • the particle size distributions of platinum and carbon phases • the placement of respective phases according to specified volume fractions • the randomness of the physical catalyst morphology • the individual transport properties of each constituent phase • Yielding the following: • Representative images of the catalyst layer • The 3-phase boundary length of the platinum/carbon/ionomer phases • The effect of the catalyst composition on the effective transport properties (protonic, electronic, gas, thermal) • The estimated catalyst over-potential vs. current density relationship Platinum Placement The placement of the platinum is carried out by depositing a platinum particle of a given size and then choosing a random location for deposition on the exterior of a carbon surface within the domain. Examples of platinum (red) placement can be seen in the 2D and 3D examples below. Domain size and Periodicity The discretization of the domain is done by decomposing the sample cube via the finite volume approach. The data and phases are stored in a cell-centred format. The grid generation and sizing is predominately controlled by the number of control volumes necessary to adequately resolve the smallest platinum particle (~1.0nm). This is an effect of surface tessellation which results in an over-approximation of the surface area of the sphere. Looking at the Table below it is clear that due to the resolution needed, parallelization is an attractive solution. Hence the need for a periodic domain. A simple example of a periodic domain is shown below. Ionomer Placement The placement of the ionomer can be done according to two different methods. The first method places concentric rings around existing carbon particles, which may be offset from the center of the carbon sphere. The second method randomly deposits ionomer on any existing surface within the domain.