Download
1 / 20
200 likes | 322 Views
Learn about the comprehensive marine monitoring efforts in the Southern California Bight, addressing pollution impacts and cumulative effects through collaborative surveys every five years. The program aims to answer critical questions about the region's health.

E N D
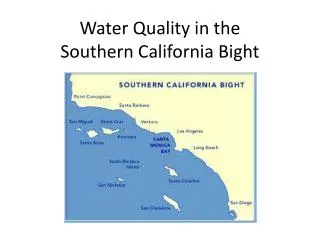
Southern California Bight Regional Marine Monitoring Program Ken Schiff www.SCCWRP.org
Monitoring in the Southern California Bight • More than $31M per year monitoring the SCB • Ca. 75% is by NPDES permittees • Approximately 5% of the areas is routinely monitored • Inconsistency in the areas that are monitored • Unable to answer basic questions about the health of the SCB
Development of Regional Marine Monitoring • Regional Monitoring surveys every five years • aka the “Bight Program” (1994, 1998, 2003) • Integrated, collaborative monitoring using existing local programs • Periodic “trade-off” for site-specific monitoring • Address cumulative effects • Assess the range of natural variability
Bight ’03 as an Example • 61 Organizations • $7M Program • Less than $700K cash • Three major components • Coastal Ecology • Shoreline microbiology • Water quality
Coastal Ecology Component • What is the spatial extent and magnitude of impact in the SCB? • How does this vary among areas of interest? • What is the mass of pollutants in the SCB? • Sediments, water, biota? • How does this compare to emissions from land-based discharges?
Areas of Interest • Offshore • Depth zones from surfzone to deep coastal basins • Embayment • Ports, harbors, marinas, estuaries • Publicly owned treatment works (POTWs) • Large, small • Channel islands
Indicators • Sediment characteristics • Sediment chemistry • Sediment toxicity • Infaunal biological community • Fish community • Fish bioaccumulation • Fish pathology • Debris and trash
Biological Effects in Embayments (Benthic Response Index)
Shoreline Microbiology Component • What is the extent and magnitude of shoreline impacted by bacteria? • How does it vary by area? • Are fecal indicator bacteria correlated with human specific virus? • What is the relationship between shoreline concentrations and surfzone concentrations?
Indicators • Fecal indicator bacteria • Total coliforms, fecal coliforms, enterococci • New methods • Rapid indicators • Human specific virus
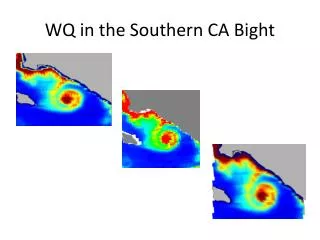
Water Quality Component • What is the extent of stormwater plumes in the coastal oceans? • What is the temporal lifecycle of plumes? • What is the impact of stormwater plumes ? • Is remote sensing a useful monitoring technique? • Use boats for groundtruthing
Indicators • Remotely sensed data • space, air, ground, water • Water quality data • Physical data • Nutrients, trace metals, trace organics, toxicity • Biological data • Plankton, domoic acid
Collaboration is a Powerful and Positive Force • Greater perspective of environmental condition • More than any single agency can accomplish • Development of regional scale assessment tools • Biocriteria, Sediment quality objectives • Excellent platform to test new ideas and technology • Remote sensing, in situ samplers, others • New chemicals of concern, improved methodology
Collaboration is a Powerful and Positive Force • Requires work to assure comparability • Quality assurance, information management, etc • Fosters communication • Regulated, regulatory, environmental communities must agree on data assessment • Results are directly integrated into the management framework • Regional monitoring being written into NPDES permits