Wind
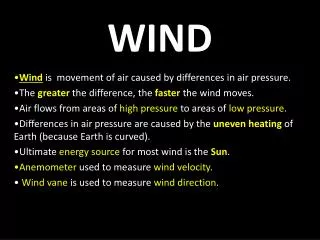
Wind. Wind. Provides natural ventilation and usually cools buildings/people because it accelerates the rate of heat transfer Speed and direction change throughout the day and year. Not as predictable as the sun’s path Wind rose diagrams help visualize the patterns at a site. Negatives.

Wind
E N D
Presentation Transcript
Wind • Provides natural ventilation and usually cools buildings/people because it accelerates the rate of heat transfer • Speed and direction change throughout the day and year. Not as predictable as the sun’s path • Wind rose diagrams help visualize the patterns at a site
Negatives • Drive moisture and water up through small gaps and punctures in rain screen and building envelope • Not as effective as PV for small scale applications
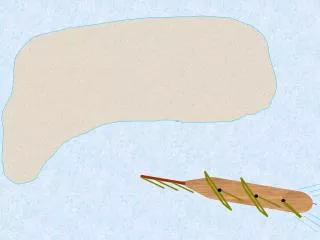
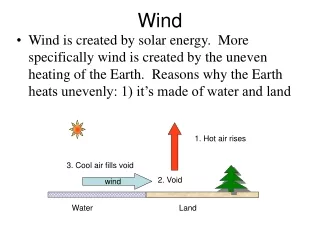
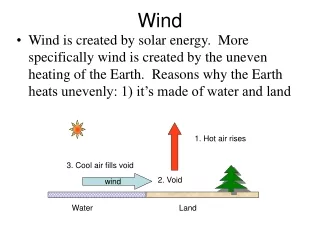
Predicting Wind Behavior • Air flows from high pressure to low pressure • When wind encounters an obstruction it will flow around the object and continue moving in the same direction (doesn’t stop the wind, just deflects it)
Predicting Behavior • Varies with height and terrain • As elevation increases, so does wind speed • As terrain becomes rougher, the rate at which wind speed increases slows • This rate of increase is known as wind gradient, or wind profile • Wind velocity can vary between terrains at the same elevation
Predicting Behavior • In dense urban environments, wind will reach 100% velocity at a higher altitude than an open environment with no buildings • Wind does not reach full speed until a certain height off the ground, this depends on obstructions
Wind and Microclimates • Environmental surroundings can create microclimates that can significantly alter wind patterns • Directions can change due to adjacent landforms, buildings or other objects • Features to pay attention to • Large bodies of water • Changes in elevation
Wind and Microclimates • General assumptions can be made about the air flow • Near bodies of water the land is hotter during the day so as the air over the land gets warmer and rises it is replaced by cooler air coming from the water. So the wind is blowing from the water onto the land • At night this is reversed, the water is warmer than the land so the air over the water gets warmer and rises and is replaced by cooler air coming from the land. So the wind blows from land to the water
General Assumptions • In a valley wind will blow uphill because the sun warms the air and causes it o rise • At night wind will blow downhill because the air is cooled by the cold ground surface causing it to sink into the valley
Wind Speed • Measured in knots, miles per hours, meters per second, or feet per second • Wind Speeds
Wind Rose Diagrams • Most common way of displaying wind data and can be measured in a speed distribution or a frequency distribution • Can be a yearly average or made for specific seasons, some include air temp info
How to Read Wind Rose • Shows the speed and direction of wind • As you move outward on the radial scale the frequency associated with wind coming from that direction increases • Each spoke is divided by color into wind speed ranges • Radial length of each spoke around the circle is the percentage of time wind blows from that direction
Wind Rose Speed Distribution • Winds from the NW and SSW directions are most common. Of the winds from the SSW direction, wind speeds are most often in the 6-9 and 9-11 knot range (yellow and light blue).
Wind Rose Frequency Distribution • Same data as on the speed distribution, except radial scale represents wind speed rather than % of time. Also the colored segments of each spoke represent hours rather than speed
Wind Data • Climate data, including wind patterns mostly comes from airports • Typically collected at 30 ft (10m) above the ground
Wind Power • Varies roughly by the square root of the change in altitude. So the tops of buildings will experience faster wind than the ground level. • If you increase the tower height by 4x you double the power (increase power by 100%) • More effective on tall towers than at ground level