The Iphone biosensor
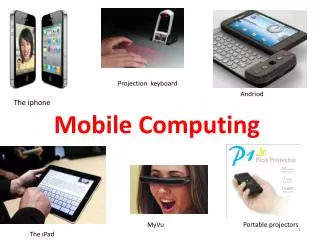
The Iphone biosensor. Group 5 Da Wei, David Wickland , & Derek Graff ECE 445 Senior Design December 2, 2011. Introduction. Attachment and iPhone Application Turns iPhone 4 into Spectrometer Utilizes Photonic Crystal to Evaluate Biomaterial Benefits: Cheaper Mobile .

The Iphone biosensor
E N D
Presentation Transcript
The Iphone biosensor Group 5 Da Wei, David Wickland, & Derek Graff ECE 445 Senior Design December 2, 2011
Introduction • Attachment and iPhone Application • Turns iPhone 4 into Spectrometer • Utilizes Photonic Crystal to Evaluate Biomaterial • Benefits: • Cheaper • Mobile
Presentation Outline • System Overview • Optical Design • Box Design • Programming • Tests Performed • Challenges • Future Development
System Overview • Hardware: • iPhone 4 • Plastic Attachment (Ford Lab) • Collimator • Transmission Grating • Photonic Crystal • Polarizer • Mirrors • Software: • iPhone Application
Components • iPhone 4 LED • Light Source of System • Emits Mostly Visible Light • Extremely Bright • Collimating Tube • Aligns The Propagation Direction Of Light • Needed For Clearest Diffraction Pattern • Polarizer • Aligns The Oscillations Of Light • Needed For Clear TE/TM Resonant Mode Of Crystal
Components • Photonic Crystal • Periodic Dielectric • Band Gap Forbids Propagation Of Certain Frequency Ranges (Resonant Modes) • Modes Can Be Altered With Surface Biochemicals • Diffraction Grating • Glass With Periodic Surface Etching • Diffracts Light Angled Proportionally To Wavelength • Grating Equation: d sinθ=mλ
Components • Beam Expander • Aptly Named • Increases Beam Diameter • 2 Focusing Optical Components Placed The Sum Of Their Focal Distances Apart • Magnifies By Focal Length Ratio • iPhone CCD Array • Charge-Coupled Devices • Array Of Small Capacitors • Detect Light Intensity
Initial Results • Original Setup Somewhat Disheartening • Difficult Alignment On Optical Table • Extremely Unstable • Spectrum Small • Blurred Results • Too Intense
Problems With Beam Expander • Expensive • Error Prone • Extra Alignment Parameters • Extremely Small Tolerances • Troublesome Part Size Variation • Larger Than Necessary • Limited Benefit
Other Changes • Measuring Crystal’s Transmission Easier Than Reflection • Transmission Gradient Instead Of Reflection • Can Be Closer To Actual Lens • Less Alignment Parameters • Mirrors To Correctly Angle Light Into Grating • Additional Slit To Filter Out Intensity And Ensure Collimated Light
Performance • Theoretical Resolution: 0.29 nm/pixel • Experimental Resolution: • True Resolution Slightly Worse • Chromatic Coma • Intensity Saturation • Grating Imperfections • Sources Of Error • Manual Alignment • System Prone To Slight Movement • Box Design Should Help
Performance • Results Comparable To General Commercial Slit Spectrometer • Still Suffered From Excess Intensity Spectrum Of Incandescent Light -Science Photo Library iPhone Results
Ford Lab Production • Printer: Eden 350 (Objet Geometries, Ltd.) • Material: Vero Black • Software Used: Pro Engineer • File Format: .stl
Top View 64 mm 60.5 mm
Bottom View 60 mm 10.5 mm
Front and Side View Front Side 34 mm 34 mm 64 mm 60.5 mm
Problems • We couldn’t seal off the light from the LED. • The plastic “gunk” left in the collimator cavity.
Components 1. Camera control 2. Pixel data extraction 3. RGB to Intensity conversion 4. Valid area estimation 5. Median filter 6. Averaging filter 7. Peak area estimation 8. Raw data integration 9. Curve fitting 10. Pixel index to wavelength translation
RGB to Intensity conversion • Unbiased algorithm:Intensity = max(R, G, B);
Valid area estimation • Very narrow spectra is captured • Large invalid area • Thermal noise significantly reduced the contrast of the spectra
Valid area estimation • Observe a fact: the sum of rows with spectra data is greater than the sum of rows without spectra data
Valid area estimation • Result:
Median filter • Basic rectangle window based algorithm • Window size 3 X 3 pixels
Averaging filter • Take the average value of each column
Averaging filter • Reverse the intensity curve
Averaging filter • Calculate the slope of the curve
Averaging filter • Filter out the irrelative part
Peak area estimation & Raw data integration • Gauss-Newton method need a start point • Gauss-Newton method may produce diverge result for even symmetry function
Curve fitting • Fitting integration of Gaussian curve • Approximation model:logistic function • Trigger condition: error per pixel greater than 1
Curve fitting • Testing case
Pixel index to wavelength translation IPhone CCD IPhone lenses Grating From experiment (acetone, 567.8 nm): = 0.001103
Isopropanol Test- Spectrometer Reading iPhone Result- 561.34 nm
Challenges • Optical table limitations • Unstable iPhone holder • Lack of access to parts • Optical Simulation Software • Large size tolerances • Difficult to access lab • Ford Lab • Objective C limitations
Future Development • Try to implement improved beam expander. • Utilize one dimensional convex lens for wider spectrum • Light-proofing box • Create better user interface • Secure all data acquired • Utilize dynamic filtering • Develop software to analyze spectrometer readings