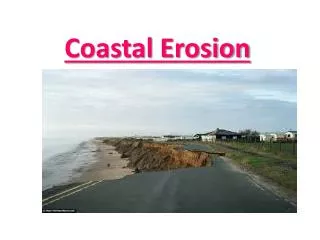
Processing & Presenting Coastal Results
This resource provides a detailed methodology for presenting coastal results through field sketching, guiding students in redrawing sketches with structured techniques. It includes drawing techniques, using grids, and annotating sketches to enhance understanding. The guide proceeds to construct beach profiles and cross-profiles using graph paper, emphasizing slope angles and color coding for clarity. Additionally, it focuses on beach fabric analysis and evaluating the phases of investigations, stimulating critical thinking through specific questions. Ideal for geography educators and students.

Processing & Presenting Coastal Results
E N D
Presentation Transcript
Fieldsketching • Get students to redraw the fieldsketch • Draw the fieldsketch on the OHP to guide them • Use the 9 part grid as a guide • Colour and title the sketch • Annotate the sketch • Ask students questions on the sketch to help them draw conclusions
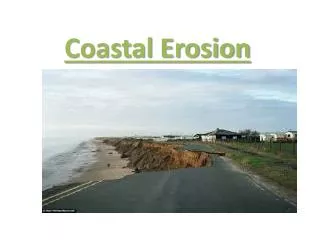
ANNOTATING GRASSCLIFF BAY ROCKYCLIFF NOTCH SEA STORMBEACH SAND PEBBLES
Constructing Beach Profile • Use graph paper • Copy graph paper onto acetate for use on OHP • Add up the length of each section of slope • Decide on a scale which will fit the profile onto one sheet of graph paper • Begin by drawing the sea • Use a protractor to get the slope angles • Draw the angles in pencil • Colour the profile
Constructing a Cross Profile of a Beach Construction Lines Profile Lines
Constructing a Cross Profile of a Beach Length Construction Lines Profile Lines
Constructing a Cross Profile of a Beach 2 1 Construction Lines Profile Lines
Constructing a Cross profile of a Beach Construction Lines Profile Lines
Beach Fabric Analysis • Using the material size from the recording sheet calculate the average size at each of the three sites Total of long axes ÷ 12 • Draw scaled diagrams of the average size onto graph paper
Evaluation • Evaluate the planning, fieldwork and processing phases of the investigation • Evaluation can be stimulated through a questioning approach e.g. What did you do well? What did you feel needed to be improved? What questions were raised by your investigation?