Download

1 / 71

E N D
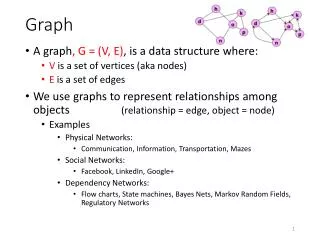
Graph Design For Effective Communication
Today, 220 years later, partly due to the arrival of the PC, graphs are commonplace, fully integrated into the fabric of modern communication. Surprisingly, however, Playfair’sinnovative efforts –sprung from meager precedent –are still superior to most of the graphs produced today.
We live in the so-called information age. • We have far more data than we’ve ever had, but our ability to make good use of it hasn’t caught up. • Information is useless until we understand what it means and can clearly communicate that meaning to those who need it, those whose decisions affect our world.
Imagine for a moment that you have just sat down in a conference room for your last meeting of the week. It’s a Friday afternoon, and you’re exhausted. You’re one of many managers in the Information Technology department. Like most meetings, this one begins with the light of a projector suddenly illuminating a screen. Bursting with excitement, the speaker announces that he’s going to introduce a brand new report that will be sitting on your desk when you arrive every morning, which will at last give you insight into what’s happening with the systems that you manage. No longer will you be in the dark. The data will be up-to-date and easy to understand. You’ll be able to take immediate action if something needs to be done. Without any further ado, here’s your new report.
You stare at this graph very intently, but with increasing agitation as you try to keep any hint of confusion from crossing your face. From your peripheral vision you can see that the others in the room are smiling and nodding with apparent understanding and approval. You feel very dumb. What you don’t realize is that you are not alone. No one can make sense of this graph.
Everyone is scrambling for metrics, key performance indicators (KPIs), scorecards, and digital dashboards. • Quantitative data is what we rely on most to measure the health of our organizations, to identify opportunities, and to anticipate the future. • Despite great progress in our ability to gather and warehouse data, we’re still missing the boat if we don’t communicate the numbers effectively. Contrary to popular wisdom, information cannot always speak for itself. • You can spend millions of dollars to build the most robust and pristine data warehouse in the world, running on the most powerful hardware, and accessed by state-of-the-art software, but if the people who work with the data don’t know how to make sense of it or how to present it clearly to decision makers, your investment is wasted.
Few people are trained. • Few people recognize the need. • Few examples of good design exist to expose the problem. • ―Poor documents are so commonplace that deciphering bad writing and bad visual design have become part of the coping skills needed to navigate in the so-called information age.
Can you make sense of this?!!! • In the two centuries since [the invention of the first graphs], …charts have become commonplace. • With the advent of modern computer tools, creating graphs from data involves trivial effort. • In fact, it has probably become too easy. Graphs are often produced without thought for their main purpose: to enlighten and inform the reader
The purpose of this graph is to display how Department G is doing regarding expenses compared to the other departments. Is the message clear? Often, when someone creates a graph that appears inadequate somehow, they try to fix it with sizzle, as in the next slide.
Does the addition of 3D improve this pie chart? Definitely not. In fact, it actually makes it harder to read.
On the other hand, though it lacks flash and dazzle, this simple bar graph tells the story elegantly.
This table was on the Web site for Bill Moyers’ public television show ―Now‖. It provided important information that deserved a better form of presentation. In this case the story could be told much better in visual form.
This series of related graphs tells the story in vivid terms and brings facts to light that might not ever be noticed in the table.
Here’s a public health example from the state of Maine. This graph contains important patterns that are difficult to discern due to clutter. It’s hard to independently discern the patterns of change through time of diagnosed AIDS cases vs. deaths or to compare these patterns to one another.
In this graph there is no clutter and the patterns are crystal clear and easy to compare.
This Edward R. Tufte quote is from his milestone work, The Visual Display of Quantitative Information, published by Graphics Press in 1983. In tables and graphs: •The message is in the data. •The medium of communication, especially for graphs, is visual. •To communicate the data effectively, you must understand visual perception –what works, what doesn’t, and why.
1.You begin by determining the best medium for your data and the message you wish to emphasize. Does it require a table or a graph? Which kind of table or graph? 2.Once you’ve decided, you must then design the individual components of that display to present the data and your message as clearly and efficiently as possible.
A picture is worth a thousand words,‖ applies quite literally to quantitative graphs. By displaying quantitative information in visual form, graphs efficiently reveal information that would otherwise require a thousand words or more to adequately describe.
Tables work great for looking up individual values, but they don’t reveal trends, patterns, and exceptions very well.
By expressing this same information visually, giving shape to the data, the trends come alive.
The fact that job satisfaction for employees without a college degree decreases significantly in their later years doesn’t jump out at you when you examine the table, but it is immediately obvious when you examine the graph.
The type of graph that is selected and the way it’s designed also have great impact on the message that is communicated. By simply switching from a line graph to a bar graph, the decrease in job satisfaction among those without college degrees in their later years is no longer as obvious.
Each of these graphs illustrates a different type of quantitative relationship. Just as in life in general, the interesting and important content of a graph always involves relationships
This graph features the relationships between values as they change through time, which is perhaps the most common quantitative relationship that you need to communicate.
Here’s an attempt to display a time-series relationship regarding HIV diagnoses, which works fairly well, but the trend and patterns could be much more clearly displayed.
Here’s the same exact data presented in two ways: to top graph uses bars and the bottom graph uses a line. Which displays the shape of change through time more clearly? Bars work well for comparing individual values to one another, but lines show the shape of change through time much more clearly
We’ve been talking about time-series relationships, but this graph features a different relationship between the values. The values are arranged in order of size, from big to small. Arranging values sequentially makes them easier to compare to one another and directly communicates the relationship of rank.
In the display of trauma registry injuries by county on the left, notice how difficult it is to compare the values and to get a sense of rank when they aren’t sequenced by size. The same information is displayed on the right, this time with the counties arranged by the number of injuries. If the purpose of the display is to look up individual values, which is the only thing that alphabetical order supports, a table would work much better.
This graph features another relationship that is commonly displayed. Notice that if you add the values they total 100%. It is a part-to-whole relationship, which shows how the individual values that make up some whole relate to one another and to the whole.
Part-to-whole relationships are typically displayed as pie charts, but they don’t communicate very effectively. If you want to see the order of items and to compare the size of one to another, with this display you would struggle,…
This graph features the next common relationship between values. This approach is used when you want to feature how one set of values differs from another reference set of values.
The difference between the median annual household income in Utah and in the U.S. as a whole isn’t shown directly in this graph
This graph directly expresses how household income in Utah has differed over time from the U.S. as a whole in positive and negative dollars.
The relationship that this graph features the spread of a set of values from lowest to highest and the shape of their distribution across that range.
A graph that attempts to show the distribution of overweight children by grade separately for boys and girls, but doing it in this way results in clutter that makes the patterns difficult to segregate and compare
This pair of histograms—one for boys and one for girls—however, are arranged in a way that makes the patterns of each easy to see, yet still easy to compare. Even better, by using lines rather than bars, the separate patterns can be shown in the same graph in a way that features the shape of the patterns and how they differ. This pair of histograms—one for boys and one for girls—however, are arranged in a way that makes the patterns of each easy to see, yet still easy to compare. Even better, by using lines rather than bars, the separate patterns can be shown in the same graph in a way that features the shape of the patterns and how they differ.
This graph illustrates the last of the six relationships. Graphs such as this feature co-relations between two paired sets of values, so this relationship is called a correlation. Correlations show whether two paired sets of measures, such as these purely fictional sets of income vs. health coverage data vary in relation to one another, and if so, in which direction (positive or negative) and to what degree (strong or weak).
Based on WHO data, explores the correlation between adult literacy and fertility rate by country. A correlation clearly exists: higher literacy corresponds to lower rates of fertility. It is also clear from this display that the highest rates of fertility all occur in Africa (the blue circles), which the one exception of Yemen (the one green circle at the high end of fertility).
Tables and graphs are made up of two types of ink: data ink and non-data ink. The ratio of ink used to display data to the total ink should be high. In other words, ink that is used to display anything that isn’t data should be reduced to a minimum
This is the kind of graph that software products, including Excel, encourage us to create. They give us an infinite selection of poorly-designed graphs from which to choose
We have now removed the useless 3-D effects and angle, which makes the data easier to read