LECTURE 27: CLUSTERING
LECTURE 27: CLUSTERING. Objectives: Mixture Densities Maximum Likelihood Estimates Application to Gaussian Mixture Models k-Means Clustering Fuzzy k- Means Clustering

LECTURE 27: CLUSTERING
E N D
Presentation Transcript
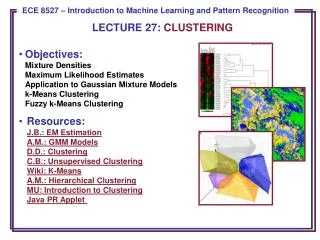
LECTURE 27: CLUSTERING • Objectives:Mixture DensitiesMaximum Likelihood EstimatesApplication to Gaussian Mixture Modelsk-Means ClusteringFuzzy k-Means Clustering • Resources:J.B.: EM EstimationA.M.: GMM ModelsD.D.: ClusteringC.B.: Unsupervised ClusteringWiki: K-MeansA.M.: Hierarchical ClusteringMU: Introduction to ClusteringJava PR Applet
Introduction • Training procedures that use labeled samples are referred to as supervised. • Unsupervised procedures use unlabeled data. • Seven basic reasons why we are interested in unsupervised methods: • Data collection and labeling data is very costly and nontrivial (often this is a research problem in itself). • Heuristic methods (application-specific) exist that allow us to improve a classifier trained using supervised techniques by introducing large amounts of unlabeled data. This is often faster than labeling data. • We would like to exploit “found” data such as that available on the Internet. Often this data is not truth-marked or is only partially transcribed. • Reversal of the training process: train on unlabeled data and then use supervision to label the groupings. • Models often need to be adapted over time. • Use unsupervised methods to find features that will be useful for categorization. • Perform rapid exploratory analysis to gain insight into a new problem. • In this chapter, we begin with parametric models and then step back and consider nonparametric techniques.
Mixture Densities • Assume: • The samples come from a known number of c classes. • The prior probabilities, P(ωj), for j = 1, …, c,are known,. • The forms of the class-conditional probability densities, p(x|ωj,θj) are known. • The values for the c parameter vectors ω1, …,ωcare unknown. • The category labels are unknown. • The probability density function for the samples is given by: • where θ= (θ1, …, θc)t. P(θj), the prior probabilities are called the mixing parameters and without loss of generality sum to one. • A density, p(x|θ), is said to be identifiable if θ≠θ’ implies there exists an xsuch that p(x|θ) ≠p(x|θ’). (A density is unidentifiable if we cannot recover a unique θfrom an infinite amount of data.) • Identifiability of θis a property of the model and not the procedure used to estimate the model. • We have already discussed methods to estimate these mixture coefficients.
Maximum Likelihood Estimates • Given a set D = {x1, …, xn} of n unlabeled samples drawn independently from the mixture density, the likelihood of the observed samples is: • The maximum likelihood estimate is the value of θthat maximizes p(D|θ). • If we differentiate the log-likelihood: • Assume ωiandθj are functionally independent if i≠ j. • Substitute the posterior: • The gradient can be written as: • The gradient must vanish at the value of θithat maximizes the log likelihood. Therefore, the ML solution must satisfy:
We can generalize these results to include the prior probability, P(ωi), among the unknown quantities. The search for the maximum value of p(D|θ) extends over θand P(ωi), subject to the constraints: It can be shown that the ML estimate for the prior is: The first equation simply states the estimate of the prior is computed by averaging over the entire data set. The third equation we have seen before in the HMM section of this course. The second equation just restates the ML principle that the optimal value of θproducesa maximum. So the good news here is that doing the obvious maximizes the posterior. Generalization of the ML Estimate
If the only unknown quantities are the mean vectors, μi, we can write: and its derivative: The ML solution must satisfy: Rearranging terms: But this does not give us a new estimate explicitly, nor does it typically give closed form solutions. Instead, we can use a gradient-descent approach: Unknown Mean Vectors
Example • Consider the simple two-component one-dimensional normal mixture. • Generate 25 samples sequentially assuming μ1= -2 and μ 2 = 2. • The likelihood function is calculated as a function of the estimates for the two means. • We see that while the maximum is achieved near the true means, there are two peaks of comparable height: • μ1= -2.130 and μ2= = 1.668 • μ1= 2.085 and μ2= -1.257.
All Parameters Unknown • If the means, covariances, and priors are all unknown, the ML principle yields singular solutions. • If we only consider solutions in the neighborhood of the largest local maximum, we can derive estimation equations:
An approximate technique to determine the parameters of a mixture distribution is k-Means: k is the number of cluster centers, c, and “means” refers to the iterative process for finding the cluster centroids. We observe that the probability, , is large when the squared Mahalanobis distance, , is small. Suppose we merely compute the squared Euclidean distance, , find the mean nearest to xk, and approximate as: We can formally define the k-Means clustering algorithm: Initialize: select the number of clusters, c, and seed the means, μ1, …, μn. Iterate: Classify n samples according to the nearest mean, μi. Recompute each mean using the ni samples assigned to cluster i. Until: no change in μi. Done: return μ1, …, μn. Later we will see this is one case of an iterative optimization algorithm. There are many ways to cluster, recompute means, merge/split clusters and stop. K-Means Clustering
In k-Means, each data point is assumed to reside in one and only one cluster. We can allow “fuzzy” membership – a data point can appear in a cluster with probability . We can minimize a heuristic global cost function: where b is a free parameter that adjusts the blending of different clusters. The probabilities of cluster membership for each point are normalized as: The relevant reestimation equations are: This can be viewed as a form of soft quantization, and fits nicely with our general notion of probabilistic modeling and EM estimation. Fuzzy K-Means Clustering
Summary • Introduced the concept of unsupervised clustering. • Reviewed the reestimation equations for ML estimates of mixtures. • Discussed application to Gaussian mixture distributions. • Introduced k-Means and Fuzzy k-Means clustering. • Demonstrated clustering using the Java Pattern Recognition applet.