
Understanding Correlation: Definition, Types, and Importance in Data Analysis
Correlation measures the degree of relationship between two or more variables, such as smoking and lung cancer rates. This guide explains different types of correlation, including positive, negative, and zero correlation, and illustrates how to create scatterplots for data representation. It also introduces the Pearson Product-Moment Correlation Coefficient (Pearson r) as a summary measure of linear relationships. With practical activities, this resource helps interpret correlation values, understand significance tests, and navigate the nuances of correlation versus causation.

Understanding Correlation: Definition, Types, and Importance in Data Analysis
E N D
Presentation Transcript
Correlation • Definition: the degree of relationship between two or more variables. • For example, smoking and lung cancer are correlated: • if we look at the number of people who smoke and the number of people who die of lung cancer over the course of 80 years, we see a correlation.
But… • Does this mean that smoking causes lung cancer? • How do we make sense of data when we want to know if two variables are correlated? • Can things be more or less correlated?
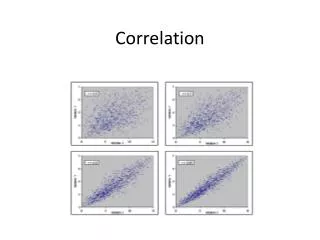
Scatterplots • The most common graphical representation of data for the purpose of correlation is the scatterplot. • Points for each individual are plotted based on the individual’s X score and Y score.
Activity #1 • Create a scatterplot for the following data:
Positive Correlation • A high score on one variable is associated with a high score on the other and vice versa.
Negative Correlation • A high score on one variable is associated with a low score on the other and vice versa.
Zero Correlation • There is no relationship between the two variables.
How About This One? Negative Zero Positive
The Pearson Product-Moment Correlation Coefficient • Pearson r • A summary measure of the direction and degree of linear relationship between two variables. • An estimate of ρ (rho), the population correlation coefficient.
Conceptual Formula • Multiply the z-score for X and Y for each individual, and then add them all up and divide the sum by N (the number of individuals). • To compute using this formula, we would need to determine the standard deviation for both X and Y, then determine the z-score for each raw score (X and Y).
Conceptual Formula • How does this formula work? • If your two variables are positively correlated, many of the X scores with positive z-scores will be paired with Y scores with positive z-scores. And many X scores with negative z-scores will be paired with Y scores with negative z-scores. • If you multiply two positive numbers or two negative numbers, you will get a positive number. If you have a whole bunch of positive products and add them up, you will get a large positive number.
Conceptual Formula • If your two variables are negatively correlated, many X scores with positive z-scores will be paired with many Y scores with negative z-scores and vice versa. • If you multiply a negative and a positive number, you get a negative number. If you add up a whole bunch of negative products, you would get a large negative number.
Covariance • You can also understand r as a measure of covariance, or how much X and Y vary together. • We are already familiar with variance, and this will help us understand covariance.
Covariance • If we rewrite this formula: • …and think of it as a measure of how much X scores vary with other X scores, we can write a new formula that determines how much X scores vary with Y scores:
Covariance • To find r we need to “standardize” the covariance, which means that we will have to use the standard deviation. • Think of it like this: • To do this with covariance, we have to consider the standard deviations of both X and Y. We do this by multiplying them, and putting them in the denominator:
Pearson r • Regardless of the formula you use, you will get the same result. • rwill never be larger than 1 or smaller than -1. • The larger the obtained r(negative or positive), the more closely correlated the two variables are. • If the ris close to zero, the variables are probably not correlated. • If ris large and negative, you have a negative correlation. If ris large and positive, you have a positive correlation.
Activity #2 • Determine r for the following data set:
Activity #2 • Step 1: Calculate the standard deviation of X • Step 2: Calculate the standard deviation of Y • Step 3: Calculate the covariance • Step 4: Calculate r
Activity #2 • Standard Deviation of X = 1.36 • Standard Deviation of Y = 10.023 • Covariance = 2.723 • r = .1997 = .2
Significance Test for r • H0: ρ = 0 • Use df = N – 2 (N is the number of individuals or rows, and two because we have two data sets) • Look at the table of critical values for r. • Just like t and F if the obtained r exceeds the critical r, your result is statistically significant at the specified α level. • Interpretation is the same: The probability of getting results this extreme or more extreme if the null hypothesis is true is less than .05 (or .01).
Interpreting Correlation • Despite what you have probably heard over and over again (ad nauseam), correlation CAN imply causation. • Remember, design trumps analysis. • If the data we just analyzed turned out to be “significantly” correlated AND I randomly assigned students to high and low exercise groups I could make causal statements.
Interpreting Correlation • The reason you hear “correlation does not imply causation” is that most correlation analyses are conducted on data that are not from a true experiment (i.e., no random assignment). • For example, the smoking and lung cancer data were not the result of an experiment. So, even if the two variables are causally related, we cannot make causal statements about them.
What are the alternatives to causation? • The reverse could be true: the more firefighters fighting a fire, the bigger the fire is, so do firefighters cause fires to be larger? • They might both cause each other: exercising causes someone’s health to improve, which is influential in their exercising more (because they “feel like it”) • They might both be caused by another variable: Falling asleep with one’s shoes on is correlated with waking up with a headache, but these are both caused by getting completely blitzed the night before. • Complete coincidence: for example, the number of churches in the U.S. has been rising steadily and so has the average global temperature (but there may actually be a better explanation for this example).
Homework • Study for Chapter 13 Quiz • Read Chapter 14 • Do Chapter 13 HW


