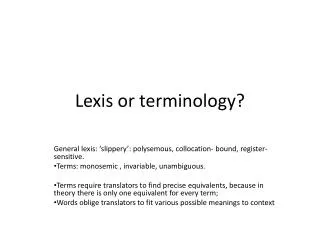
DIAGRAM LEXIS
170 likes | 905 Views
DIAGRAM LEXIS. EXACT AGE. 5. 4. 4. 3. 3. LBD. 2. 2. P. 1. E, B. 1. d. 0. a. 0. 90. 91. 92. 93. 94. 95. YEAR. Suatu presentasi grafis dari data demografi dlm konsep waktu Alat bantu analisis suatu kohort (survival analysis). PYL. 5x3=15 2x1=2 4x2=8

DIAGRAM LEXIS
E N D
Presentation Transcript
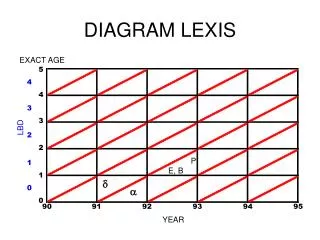
DIAGRAM LEXIS EXACT AGE 5 4 4 3 3 LBD 2 2 P 1 E, B 1 d 0 a 0 90 91 92 93 94 95 YEAR
Suatu presentasi grafis dari data demografi dlm konsep waktu • Alat bantu analisis suatu kohort (survival analysis)
PYL • 5x3=15 • 2x1=2 • 4x2=8 • Mid pop=(5+4)/2=4,5; PYL=25 0 1 2 3 4 5
EXACT AGE 5 4 4 3 3 LBD 2 2 1 1 0 0 90 91 92 93 94 95 YEAR
3. Gambarkan dalam Lexis diagram: a) Terdapat 15 kematian pada tahun 2003 dan 2004 anak berumur 1 tahun dan berasal dari satu kohor. b) Pada tahun 2004 terdapat 105 anak yang dapat berulang tahun kedua. c) Andai kata kohor tersebut (soal no 3a) tidak ada kematian bayi, berapa jumlah kelahiran kohor tersebut? d) Berapa jumlah bayi pada awal tahun 2003 ?