Download
1 / 41
410 likes | 566 Views
Conservation Biology (Ecology) Lecture 8 December 2009. Salit Kark The Biodiversity Research Group Department of Evolution, Systematics and Ecology The Silberman Institute of Life Sciences The Hebrew University of Jerusalem. A dispersal buffer: an isoline of dispersal probability.

E N D
Conservation Biology (Ecology) Lecture 8 December 2009 Salit Kark The Biodiversity Research Group Department of Evolution, Systematics and Ecology The Silberman Institute of Life Sciences The Hebrew University of Jerusalem Dr. Salit Kark. The Hebrew University of Jerusalem
A dispersal buffer: an isoline of dispersal probability Metapopulation Types A subpopulation A. Patchy B. Classical Separate metapopulations C. Nonequilibrium D. Mainland-Island Dr. Salit Kark. The Hebrew University of Jerusalem
Highly connected Patchy Mainland- Mainland Patch isolation Mainland- Island Classical Highly isolated Nonequilibrium Disjunct All small All large Patch Size Dr. Salit Kark. The Hebrew University of Jerusalem
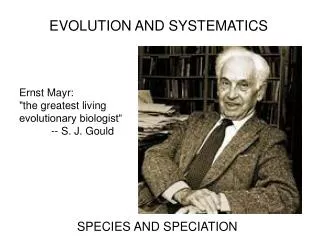
The case study of the Florida Scrub Jay Aphelocomacoerulescens Dr. Salit Kark. The Hebrew University of Jerusalem
Biology of the Florida Scrub Jay • Florida’s only endemic bird species • Juveniles disperse after one year • Cooperative breeding • The bird was listed as threatened species in 1987 by the U.S. Fish and Wildlife Service (USFWS) Dr. Salit Kark. The Hebrew University of Jerusalem
Distribution of Florida scrub jay groups in 1993. Note the discontinuous distribution and variability in patterns of aggregation Dr. Salit Kark. The Hebrew University of Jerusalem
Statewide jay distribution with dispersal buffers. Shaded areas depict subpopulations within easy dispersal distance (3.5 km) of one another (191 separate subpopulations). Thick outer lines delineate demographically independent (42 metapopulations) separated from each other by at least 12 km A metapopulation 12 km 3.5 km A subpopulation Dr. Salit Kark. The Hebrew University of Jerusalem
A subpopulation buffer is the distance where occupancy rates remain high Accumulative 97% 85% Frequency 3.5 km 6.7 km Dispersal Distance (km) From natal to breeding territories 1970-1993 Dr. Salit Kark. The Hebrew University of Jerusalem
Examples of Nonequilibrium metapopulations 3.5 km 12 km North Gulf Coast of Florida: each of the 6 metapopulations contains fewer than 10 pairs of jays, except for the centrally located system that contains a single, midland-sized subpopulation Dr. Salit Kark. The Hebrew University of Jerusalem
Examples of a “classical” metapopulation from 3 counties in central Florida. Note the occurrence of jays in small islands of intermediate distance from one another. Dr. Salit Kark. The Hebrew University of Jerusalem
Portion of the largest mainland-midland-island metpopulation in interior Florida. The large central subpopulation (enclosed by the thin black line) contains nearly 800 pairs of jays. Small subpopulations to the south and east are within known dispersal distance of the large, central mainland. A small metapopulation to the west (in DeSoto County) contains a single subpopulation of 21 territories. Dr. Salit Kark. The Hebrew University of Jerusalem
Statewide jay distribution with dispersal buffers. Shaded areas depict subpopulations within easy dispersal distance (3.5 km) of one another (191 separate subpopulations). Thick outer lines delineate demographically independent (42 metapopulations) separated from each other by at least 12 km A metapopulation 12 km 3.5 km A subpopulation Dr. Salit Kark. The Hebrew University of Jerusalem
Total 191 subpopulations Frequency Only Six subpopulations > 100 birds Subpopulation Size (# of birds) Numbers above the bars indicate the number of subpopulations Dr. Salit Kark. The Hebrew University of Jerusalem
Nonequilibrium metapopulations Total 42 metapopulations Frequency Metapopulation Size Dr. Salit Kark. The Hebrew University of Jerusalem
PVA Model Biology of Individuals Environmental Factors Population Dynamics (demography) Population Survival or Extinction
PVA Model Environmental disturbance Biology of Individuals Environmental Factors --Growth --Population (n) --Distribution Population Dynamics (demography) Genetic effective P size Demographic uncertainty Extinction (Deterministic) Extinction
Deterministic extinction: • Extinction resulting from some inexorable change or force from which there is no escape. • Such as the effect of: • Glaciations • Deforestation, divergence of river
PVA Model Major loss of habitat Biology of Individuals Environmental Factors Population Dynamics (demography) Extinction (Deterministic) Fragmentation -- Population size -- Distribution Extinction Demographic randomness
Population Viability Analysis (PVA) PVA is the study of how the main demographic factors interact to determine extinction probability of a population and to estimate MVP. MVP - Minimum Viable Population imply some thresholds for the number of individuals that will insure (at some acceptable level of risk) that a population will persist in a viable state for a given interval of time
Approaches to PVA • Count-based PVA • Uses census data • Assumes all individuals identical • Demographic PVA • Incorporates information about vital rates • vital rates: probabilities of survival and reproduction • Can include population structure • Spatially explicit PVA • Incorporates migration and colonization
Approaches to PVA Biological realism Data requirements Bias Precision Bias—a systematic error that contributes to the difference between the mean of a large number of test results and an accepted reference value; Precision—the closeness of agreement among test results obtained under prescribed conditions.
Why run population “viability”analysis? U.S. Endangered Species Act (1973) codifies in law a national policy of avoiding the extinction of species U.S. National Forest Management Act (1976) “[f]ish and wildlife habitat shall be managed to maintain viable populations of existing native and desired nonnative vertebrate species in the planning area…In order to insure that viable populations will be maintained, habitat must be provided to support at least a minimum number of reproductive individuals and the habitat must be well distributed so that those individuals can interact with others in the planning area”
Demographic Stochasticity - Random Demographic Variation Arises because, at any time, individuals of a given age or developmental stage have probabilities of survival and reproduction, called vital rates. Assuming that these apply independently to each individual, demographic stochasticity produces sampling variances of the vital rates inversely proportional to population size
In any real population, individuals don’t usually produce the average number of offspring. They usually have more than the average, fewer than the average, or have no offspring • As long as the population size is large the average provides a rather good description of the population • But, once the population size drops below a certain size (say 50 individuals), individual variation in birth and death rates begin to cause the population size to fluctuate randomly up and down
If population size fluctuates downward, then the resulting smaller population will be even more susceptible to demographic fluctuations in the next generation, possibly resulting in extinction Sampling Variance Population Size
In contrast to demographic stochasticity, Environmental Stochasticity is represented by temporal changes in the vital rates that affect all individuals of a given age or stage similarly.The sampling variances of the vital rates are then nearly independent of population size vital rates: probabilities of survival and reproduction
Some Real World Examples: One of the best documented cases where demographic stochasticity likely played a role, comes from a study of the persistence of 120 bighorn sheep populations followed for up to 70 years in the US southwest Berger, J. 1990. Persistence of different-sized populations: an empirical assessment of rapid extinctions in bighorn sheep. Conservation Biology 4:91-98
All the populations with fewer than 50 individuals went extinct within 50 yearsn of 50-100 is a threshold Population size N=101+ % OF POPULATIONS PERSISTING 51-100 16-30 31-50 1-15 10 20 30 40 50 TIME (YEARS)
Extinction rates of birds on Channel Islands as a function of population size over an 80-year period 60 % Extinction 10 breeding pairs – 39% went extinct 10-100 pairs – 10% went extinct 1000>pairs – none went extinct * * 30 * - extinction rate of all species in a given population size class * * * 0 * * 1 10 100 1000 10,000 Population Size (no. pairs) Jones, L. and J. Diamond. 1976. Short-term base studies of turnover in breeding bird populations on the California Channel Islands. Condor 78:526-549.
PVA requires lots of data, which takes time, work, and money, whereas managers want answers (predictions on extinction) now. • Few species will get thorough PVA. • When should PVA be used and what type of PVA (how complex)? • Predictions from PVA can only be as good as the data that go into the analysis. We can only have probabilities in the predictions from PVA. • Populations should not be managed to their “minimum viable population”size. One of the greatest strengths of PVA is the ability to play “what if”games with the model. Some thoughts on PVA
How do we decide what to conserve? Setting conservation priorities
Setting conservation priorities קביעת סדרי עדיפויות לשימור לפי מינים Species based לפי אזורים Area based
קביעת סדרי עדיפויות לשימור לפי מינים מעמד פוטנציאל אבולוציוני שירותים סיכון אנדמיות נדירות תפקיד במערכת קצב הכחדה פגיעות בית הגידול אסטרטגיות: דגל, מטריה, אינדיקאטור, מפתח אטרקטיביות (ניצול ע"י האדם)
Setting conservation priorities Species based Status evolutionary potential services risk endemism rarity Role in ecosystem Decline rate Habitat vulnerability Strategies: flagship, umbrella, indicator, keystone Attractiveness (human exploitation)
Strategies: focal species flagship, umbrella, indicator, keystone Focusing on important species may provide short cuts to more successful conservation • Flagship sp: charismatic, public appeal and awareness • Umbrella sp: species providing “shelter” for many others, large and diverse area required • Indicator sp: environmental change, other groups • Keystone sp: predominating ecological role in community and ecosystem functioning
Conservation status IUCN = The World Conservation Union is the world’s largest and probably most important conservation network. The Union brings together 82 States, 111 government agencies, more than 800 non-governmental organizations (NGOs), and some 10,000 scientists and experts from 181 countries in a unique worldwide partnership. The Union’s mission is to influence, encourage and assist societies throughout the world to conserve the integrity and diversity of nature and to ensure that any use of natural resources is equitable and ecologically sustainable.
Conservation status IUCN Species Survival Commission (SSU) • Provide conservation status in IUCN red list of threatened species • Updated yearly http://www.redlist.org/info/categories_criteria2001.html
The IUCN Red List Categories & Criteria have several specific aims: • to provide a system that can be applied consistently by different people; • to improve objectivity by providing users with clear guidance on how to evaluate different factors which affect the risk of extinction; • to provide a system which will facilitate comparisons across widely different taxa; • to give people using threatened species lists a better understanding of how individual species were classified.
The criteria can be applied to any taxonomic unit at or below the species level
Category in IUCN redlist • EXTINCT (EX) no reasonable doubt that the last individual has died • when exhaustive surveys have failed to record an individual • EXTINCT IN THE WILD (EW) known only to survive in captivity • CRITICALLY ENDANGERED (CR) facing an extremely high risk of extinction in the wild • ENDANGERED (EN) • VULNERABLE (VU) • NEAR THREATENED (NT) does not qualify for CE or E, but is close to qualifying in the near future • LEAST CONCERN (LC) Widespread and abundant taxa are included in this category