Download
1 / 23
230 likes | 348 Views
This project establishes a super-regional modeling testbed aimed at improving environmental forecasts for the U.S. Atlantic and Gulf of Mexico coasts. It emphasizes the need for a common cyberinfrastructure to facilitate data access, analysis, and visualization across various coastal ocean models. By creating standardized tools and metrics, the testbed aims to strengthen collaboration between academia and operational centers, ensuring robust model assessments and interoperability of data formats. Key initiatives include integrating observational datasets and enhancing the functionality of existing data systems.

E N D
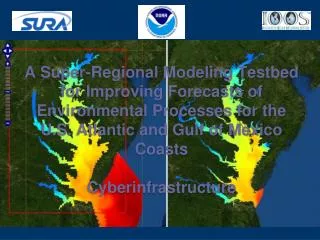
A Super-Regional Modeling Testbed for Improving Forecasts of Environmental Processes for the U.S. Atlantic and Gulf of Mexico CoastsCyberinfrastructure
A Common Cyberinfrastructure for Model Data The ocean community needs a common cyberinfrastructure to access, analyze and display data from the different models: each model currently has their own standards and toolsets Unstructured Grid StructuredGrids 5x5 6x3 Variety of Stretched Vertical Coordinates
A Testbed Framework for Coastal Ocean Models • Build a common infrastructure to enable access, analysis and visualization of all coastal ocean model data produced by Federal Backbone & RAs • Develop skill metrics and assess models in three different regions and dynamical regimes, to ensure a robust and powerful infrastructure • Identify factors for transition to operations • Build stronger relationships between academia and operational centers through collaboration
NetCDFObs NetCDF Grids THREDDS OPeNDAP ERDDAP RAMADDA Catalog • Response with Catalog list, including for each dataset • Opendap URL • WMS URL • ERDDAP URL • F-TDS URL • Feature Type (Grid, Points) • Other….. REST Request for catalog, can filter by time, geowindow, or parameter Client* PNG, or XML, or NetCDF If Point Data, use ERDDAP base URL and allow users to see where points are, download data from all points for a time period, or select from a specific point to get data If GRID Data, use Opendap URL or WMS to get images or time series data, or F-TDS to get regridded data or analysis. JSON, CSV, XML, or other *Web Client, Drupal, Matlab, ArcGIS, other…
Comparing Models with Data in Matlab Model 1: UMASS-ECOM Model 2: UMAINE-POM Data: SST 2008-Sep-08 07:32
Mapping services and browse application • Cyberinfrastructure (CI)All Regions – All Teams • Extending CI from OGC, Unidata and others (NOAA DMIT, USGS CDI) to support unstructured grids, and add functionality • Web Access via OpenDAP w/CF • Unidata Common Data Model/NetCDF Java Library API • Distributed search capability • Browser based map viewer (WMS) • Toolbox for scientific desktop analysis • All components standards-based! Search services Analyze in scientific desktop application
Inundation Extra-tropical – Gulf of MaineTropical – Gulf of Mexico- 4 models: 3 unstructured grid +1 structured grid- Coupled wave-storm surge-inundation (TWL)- Consistent forcing, validation and skill assessment using existing IMEDS tool • Extensive observational data sets for historical storms Ike, Rita and Gustav in standard formats • SURA has provided supercomputer resources Extratropical Grid Tropical Grids for Galveston Bay
Estuarine Hypoxia Chesapeake Bay 1. Estuary: – 5 Hydrodynamic models – 3 Biological (DO) models – 2004 data from 28 CBP stations – Comparing T, S, max (dS/dz), DO via target diagrams 2. Shelf: OBCs 5 hydrodynamic models Dissolved Oxygen Stratification (dS/Dz) Models doing better on oxygen than stratification!
Shelf Hypoxia Gulf of MexicoHydrodynamic & biogeochemical hindcast comparisons of hypoxia model (stand alone) coupled to 3 different Gulf of Mexico hydrodynamics models Evaluation of two shelf hypoxia formulations (NOAA & EPA)
IOOS Model Testbed - CI Status Interactive Web Site Web site where users can browse model results, view model grid data, side by side comparisons, extract time series, browse model and obs catalog, compare model and obs as time series Unstructured Grid Support Adding support for unstructured grids in the Java NetCDF libraries Matlab toolbox Matlab-based toolbox to access the model data via njtoolbox and observation data IMEDS Matlab-based IMEDS toolbox to do “station” data comparisons for the inundation team. Observation Data Implement observation data as NetCDF on server connected to TDS and Catalog
IOOS Model Testbed - CI Status ERDDAP Implementation of ERDDAP on server for different data delivery options . Ramadda Install and configure Ramadda for TDS harvesting F-TDS/LAS Implementation of F-TDS and LAS as services on the server for server-side model data regridding, analysis, and visualization. ncWMS Improvements to ncWMS for time-rounding, vectors.
Server-side Analysis • Server-side analysis is a computation made by an OPeNDAP server at the request of a client. • The specification of the computation is transmitted to the server via the OPeNDAP URL. • The data returned are the results (and only the results) of the computation • The Ferret-THREDDS Data Server (F-TDS) is an implementation of a general purpose server-side analysis engine which plugs into new or existing TDS installations.
F-TDS Capabilities • F-TDS takes advantage of several characteristics of Ferret. • New "virtual" data variables can be defined • Can build the metadata (netCDF header described by dimensions, coordinate variables and the structure of data variables) without performing any heavy calculations for both data read from files and “virtual” data variables • Only performs calculations when the data are requested • Only calculates the minimal set needed to fulfil the current request
ChesROMS: a practical example • We are serving data from Chesapeake Bay ROMS Community model • We’d like images of the water velocity model output. • Water velocity is produced in the model as separate eastward and northward velocities on the U and V elements of a single Arakawa computational grid. • Need to combine the eastward and northward components to produce velocity. But to do this, the values need to be on the same grid. • We do this with an F-TDS script. This produces an OpenDAP accessible URL, which can be operated on in standard tools such as Matlab. The eastward and northward values are translated to a common “rho” grid.
ChesROMS Eastward and Northward ComputationalGrids Full view and detail of grid: eastward grid in red, northward grid in green. These are the original computation points on which the model outputs data.
The ChesROMS grids including the “RHO” grid Black diamonds are “Rho” grid points. Eastward points in red, northward points in green. Eastward and northward velocity model output have been translated to the RHO grid by the F/TDS script.
Matlab code to plot the velocity # Get the data from the F/TDS URL url='http://testbedapps.sura.org/thredds/dodsC/estuarine_hypoxia/chesroms/vectors.nc'; nc=mDataset(url); getVars(nc) # grab the rotated u,v and grid points. The grid # is the same for both UBARROT and VBARROT u=nc{'UBARROT'}(1,:,:); v=nc{'VBARROT'}(1,:,:); g=nc{'VBARROT'}(1,:,:).grid # Convert u and v to a complex for graphing U=complex(u,v); # plot the data figure pcolorjw(g.lon,g.lat,double(abs(U))); arrows(g.lon,g.lat,U,.05,'black'); axeq colorbar
The ChesROMS Water Velocity ChessROMS Absolute Water Velocity in Meters/second ChessROMS Absolute Water Velocity in Meters/second detail with directional vectors
Demo • Interactive Web Site • Matlab • EDC • Managed System using Services
Shelf Hypoxia • What does SH team need? • Web-site(s), Catalogs, Matlab, Desktop App, Skill Assessment tools, Data Conversion utils? • Biggest Challenges