Download
1 / 59
600 likes | 693 Views
Learn about requirements analysis, analysis modeling approaches including structural and object-oriented analysis, data modeling, and data object characteristics. Explore different analysis model elements such as diagrams and narratives.

E N D
Chapter 8Analysis ModelingAdapted by Dan Fleck from:- Roger Pressman’s Slides- http://www.informatics.sussex.ac.uk/users/lb203/se/SE04.pdf- Jochen Rick’s slides from GA Institute of Technology- http://webfuse.cqu.edu.au/Courses/aut2001/95169/ Extra_Examples/DFD_Example_1/- System Analysis and Design slides edited by Yale Braunstein
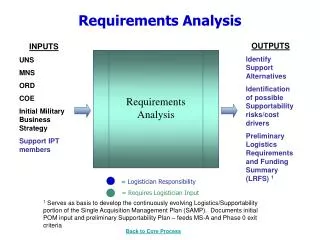
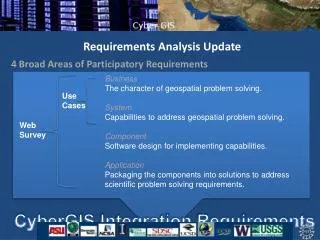
Requirements Analysis • Requirements analysis • specifies software’s operational characteristics • indicates software's interface with other system elements • establishes constraints that software must meet • Requirements analysis allows the software engineer (called an analyst or modeler in this role) to: • elaborate on basic requirements established during earlier requirement engineering tasks • build models that depict user scenarios, functional activities, problem classes and their relationships, system and class behavior, and the flow of data as it is transformed.
Analysis Phase: What is it? • Three objectives: • To describe what the customer requires • To establish a basis for the creation of a software design • To define a set of requirements that can be validated once the software is built
Analysis Modeling Approaches • Structural analysis: • The data: The model defines their attributes and relationships. • The processes that transform the data: The model shows how they transform the data objects as they flow through the system. • Object-oriented analysis: • Focus: Classes and their inter-relationships • UML is predominantly object-oriented But don’t be to dogmatic!
Elements of the Analysis Model Scenario-based elements Flow-oriented elements Use-case diagrams Use cases - text Activity Diagrams Swim lane diagrams Data-flow diagrams Control flow diagrams Processing narratives Analysis Model Class-based elements Behavioral elements Class diagrams Analysis Packages CRC Models Collaboration Diagrams State diagrams Sequence diagrams
Data Modeling • examines data objects independently of processing • focuses attention on the data domain • creates a model at the customer’s level of abstraction • indicates how data objects relate to one another
What is a Data Object? Object —something that is described by a set of attributes (data items) and that will be manipulated within the software (system) each instance of an object (e.g., a book) can be identified uniquely (e.g., ISBN #) each plays a necessary role in the system i.e., the system could not function without access to instances of the object each is described by attributes that are themselves data items What are some typical data objects?
Typical Data Objects external entities(printer, user, sensor) things (e.g, reports, displays, signals) occurrences or events(e.g., interrupt, alarm) roles (e.g., manager, engineer, salesperson) (e.g., division, team) organizational units places (e.g., manufacturing floor) structures(e.g., employee record)
Data Objects and Attributes A data object contains a set of attributes that act as an aspect, quality, characteristic, or descriptor of the object object: automobile attributes: make model body type price options code How do data objects differ from OO classes or do they?
What is a Relationship? • several instances of a relationship can exist • objects can be related in many different ways relationship —indicates “connectedness”; a "fact" that must be "remembered" by the system and cannot or is not computed or derived mechanically
ERD Notation One common form: (0, m) object object relationship 1 2 (1, 1) attribute Another common form: relationship object object 1 2 (1, 1) (0, m) See http://www.smartdraw.com/tutorials/software/erd/tutorial_01.htm for a tutorial on how to draw entity relationship diagrams.
The ERD: An Example request for service Customer places (1,1) (1,m) (1,1) standard task table (1,n) work order generates (1,1) (1,1) (1,1) (1,w) work tasks selected from consists of (1,w) (1,i) materials lists
The Flow Model Every computer-based system is an information transform .... computer based system input output
Flow Modeling Notation external entity process data flow data store
External Entity A producer or consumer of data Examples: a person, a device, a sensor Another example: computer-based system Data must always originate somewhere and must always be sent to something
Process A data transformer (changes input to output) Examples: compute taxes, determine area, format report, display graph Data must always be processed in some way to achieve system function
Data Flow Data flows through a system, beginning as input and be transformed into output. base compute triangle area area height
Data Stores Datais often stored for later use. sensor # sensor #, type, location, age look-up sensor data report required type, location, age sensor number sensor data
Data Flow Diagramming:Guidelines • all icons must be labeled with meaningful names • the DFD evolves through a number of levels of detail • always begin with a context level diagram (also called level 0) • always show external entities at level 0 • always label data flow arrows • do not represent procedural logic
Constructing a DFD—I • review the data model to isolate data objects and use a grammatical parse to determine “operations” • determine external entities (producers and consumers of data) • create a level 0 DFD
Level 0 DFD Examples processing request user requested video signal digital video processor monitor video source NTSC video signal
Constructing a DFD—II • write a narrative describing the transform • parse to determine next level transforms • “balance” the flow to maintain data flow continuity • develop a level 1 DFD • use a 1:5 (approx.) expansion ratio
The Data Flow Hierarchy a b P x y level 0 c p2 a f p1 b p4 d 5 g p3 e level 1
DFD: A practical example Launched Dec. 11, 1998, the Climate Orbiter plunged too steeply into the Martian atmosphere Sept. 23, 1999, and either burned up or crashed. In an initial failure report released Oct. 15, 2000 the review board blamed the navigation error on a communications foul-up between NASA's Jet Propulsion Laboratory and prime contractor Lockheed Martin.
Flow Modeling Notes • each bubble is refined until it does just one thing • the expansion ratio decreases as the number of levels increase • most systems require between 3 and 7 levels for an adequate flow model • a single data flow item (arrow) may be expanded as levels increase (data dictionary provides information)
Activity Diagram Supplements the use-case by providing a diagrammatic representation of procedural flow How might we make this better?
Swimlane Diagrams Allows the modeler to represent the flow of activities described by the use-case and at the same time indicate which actor (if there are multiple actors involved in a specific use-case) or analysis class has responsibility for the action described by an activity rectangle
Activity Diagram Example • To show concurrent activity, activity diagrams allow branches and joins. • You can also reference or include other activity diagrams
Lets Try It • Lets create a swimlane activity diagram for opening a Lemonade stand.
Elements of the Analysis Model Onward to data flow diagrams! Scenario-based elements Flow-oriented elements Use-case diagrams Use cases - text Activity Diagrams Swim lane diagrams Data-flow diagrams Control flow diagrams Processing narratives Analysis Model Class-based elements Behavioral elements Class diagrams Analysis Packages CRC Models Collaboration Diagrams State diagrams Sequence diagrams
Flow-Oriented Modeling Represents how data objects are transformed at they move through the system A data flow diagram (DFD) is the diagrammatic form that is used Considered by many to be an ‘old school’ approach, flow-oriented modeling continues to provide a view of the system that is unique—it should be used to supplement other analysis model elements
Elements of the Analysis Model Scenario-based elements Flow-oriented elements Use-case diagrams Use cases - text Activity Diagrams Swim lane diagrams Data-flow diagrams Control flow diagrams Processing narratives Analysis Model Oh behave! Class-based elements Behavioral elements Class diagrams Analysis Packages CRC Models Collaboration Diagrams State diagrams Sequence diagrams
Behavioral Modeling • The behavioral model indicates how software will respond to external events or stimuli. To create the model, the analyst must perform the following steps: • Evaluate all use-cases to fully understand the sequence of interaction within the system. • Identify events that drive the interaction sequence and understand how these events relate to specific objects. • Create a sequence for each use-case. • Build a state diagram for the system. • Review the behavioral model to verify accuracy and consistency.
State Representations • In the context of behavioral modeling, two different characterizations of states must be considered: • the state of each class as the system performs its function and • the state of the system as observed from the outside as the system performs its function • The state of a class takes on both passive and active characteristics [CHA93]. • A passive state is simply the current status of all of an object’s attributes. • The active state of an object indicates the current status of the object as it undergoes a continuing transformation or processing.
The States of a System • state—a set of observable circumstances that characterizes the behavior of a system at a given time • state transition—the movement from one state to another • event—an occurrence that causes the system to exhibit some predictable form of behavior • action—process that occurs as a consequence of making a transition
Behavioral Modeling • make a list of the different states of a system (How does the system behave?) • indicate how the system makes a transition from one state to another (How does the system change state?) • indicate event • indicate action • draw a state diagram or a sequence diagram
State Diagram - Lets Try It! You are designing a traffic light system for this intersection. Draw a state diagram showing the different states and how they transition. North West East South
Elements of the Analysis Model Scenario-based elements Flow-oriented elements Use-case diagrams Use cases - text Activity Diagrams Swim lane diagrams Data-flow diagrams Control flow diagrams Processing narratives Analysis Model Class-based elements Behavioral elements Class diagrams Analysis Packages CRC Models Collaboration Diagrams State diagrams Sequence diagrams Onward to Class-based elements!
Object Oriented Analysis (OOA) • The intent of OOA is to define all classes (and the relationships and behavior associated with them) that are relevant to the problem to be solved. For that, a number of tasks must occur: • Classes must be identified (i.e., attributes and methods) • A class hierarchy is defined • Object-to-object relationships should be represented • Object behavior must be modeled • Tasks 1 through 4 are reapplied iteratively
Object-Oriented Concepts • What are the basic object oriented concepts?
Object-Oriented Concepts • What are the basic object oriented concepts? • Classes and objects • Attributes and operations • Encapsulation and instantiation • Inheritance
Encapsulation/Hiding The object encapsulates both data and the logical procedures required to manipulate the data method # 2 method # 1 data method # 3 method # 6 method # 4 method # 5 Achieves“information hiding”
Scenario Based Modeling: Use-Cases “[Use-cases] are simply an aid to defining what exists outside the system (actors) and what should be performed by the system (use-cases).” Ivar Jacobson • a scenario that describes a “thread of usage” for a system • actors represent roles people or devices play as the system functions • users can play a number of different roles for a given scenario
Class-Based Modeling • Identify analysis classes by examining the problem statement • Use a “grammatical parse” to isolate potential classes • Identify the attributes of each class • Identify operations that manipulate the attributes
Domain Analysis Software domain analysis is the identification, analysis, and specification of common requirements from a specific application domain, typically for reuse on multiple projects within that application domain . . . What is object oriented domain analysis then?
Domain Analysis Software domain analysis is the identification, analysis, and specification of common requirements from a specific application domain, typically for reuse on multiple projects within that application domain . . . Object-oriented domain analysis is the identification, analysis, and specification of common, reusablecapabilities within a specific application domain, in terms of commonobjects, classes, subassemblies, and frameworks . . . Donald Firesmith
Grammatical Parsing • Write an informal description of the problem. The customer requirements document is one such description. • Underline all nouns in the description • Decide which of these are really objects which the project requires and organize them in related clusters
Grammatical Parsing University Bank will be opening in Oxford, Mississippi, in January, 2000. We plan to use a full service automated teller machine (ATM) system.The ATM system will interact with the customer through a display screen, numeric and special input keys, a bankcard reader, a deposit slot, and a receipt printer.Customers may make deposits, withdrawals, and balance inquires using the ATM machine, but the update to accounts will be handled through an interface to the Accounts system.Customers will be assigned a Personal Identification Number (PIN) and clearance level by the Security system. The PIN can be verified prior to any transaction.In the future, we would also like to support routine operations such as a change of address or phone number using the ATM