Download
1 / 37
370 likes | 467 Views
Explore the importance of expectations in the economy and their impact on public policy decisions and outcomes such as inflation, monetary policy, wage controls, and deflation. Understand the pitfalls and benefits of managing expectations through different economic policies.

E N D
Understanding the MacroeconomyChapter 3Expectations Econ 7920/Chatterjee
Why are Expectations Important? • We cannot predict the future with any degree of certainty • But expectations about the future often determine the future course of an economy • “Managing” the public’s expectations is perhaps the most important objective of public policy Econ 7920/Chatterjee
How are Expectations Formed? Modeling the formation of expectations: • Adaptive Expectations (AE): People base their expectations of the future only on past observations • Rational expectations (RE):People base their expectations on all available current information, including information about prospective futurepolicies • Critical difference: under RE, economic decisions change ONLY if there is “news” or new information about the future. Under AE, “news” has no impact on current decisions
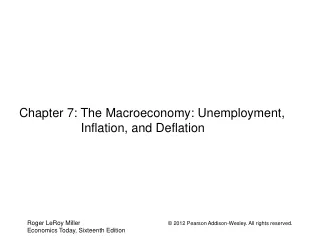
Expectations and Inflation • Expected inflation plays a crucial role in determining current inflation and interest rates • A principal objective of monetary policy: • to manage the public’s expectations of future inflation • How can this be achieved? Econ 7920/Chatterjee
Monetary Policy and Expected Inflation • For expected inflation to be low, the public must believe that the Central Bank is committed to fighting inflation • The only way this can happen is if the Central Bank has credibility with the private sector: it’s past actions confirm its commitment to keeping inflation low • Credibility is difficult to attain: often requires significant short-run sacrifices (high interest rates, unemployment and recessions) • One factor to consider: does Central Bank independence matter? Econ 7920/Chatterjee
Credibility and Autonomy in Monetary Policy Econ 7920/Chatterjee
Wage and Price Controls • Can inflationary expectations be controlled by non-monetary measures? • A popular policy measure: impose wage and price controls • If the government mandates that it is illegal for prices and wages to increase above a pre-specified ceiling, wouldn’t that stabilize expectations of future inflation? • Wage and Price controls simply do not work. Why? Econ 7920/Chatterjee
Problems with Wage and Price Controls • Extremely difficult to commit to and monitor such policies and punish violators • These policies inevitably create huge shortages and involve a misallocation of scarce resources becomes self-perpetuating Econ 7920/Chatterjee
Inflation Targeting • Inflation targeting: • Central Bank announces a target rate of inflation (usually 2-3 percent) • It raises or lowers interest rates to keep inflation at the target rate • Advantage: as long as there is credibility, inflationary spirals can be avoided • Disadvantage: if the economy faces a large supply-side shock (an oil price increase), maintaining the target can be difficult Econ 7920/Chatterjee
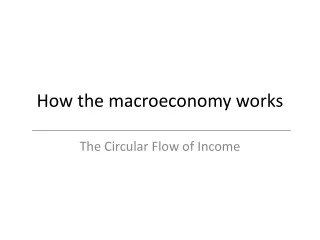
Expectations and Output Econ 7920/Chatterjee
“Supply Creates its Own Demand”-J.B. Say (19th century French Economist) • Does “Say’s Law” always work? • Consider the following sequence: • For some reason, consumers suddenly expect bad times in the near future cut back on spending • Firms face lower orders for goods and services cut back on employment and investment lay off workers and keep machines idle • The rising unemployment causes a reduction household incomes further cut-backs in spending further reduction in production of goods • Leads to a downward spiral in economic activity severe recession (self-fulfilling prophecy) • “Paradox of Poverty in the Midst of Plenty” – Keynes (1936) • How can monetary and fiscal policy correct this “paradox”? Econ 7920/Chatterjee
Using Monetary Policy to Stabilize Output • In a recession, the Central bank can implement an expansionary monetary policy • Increasing money supply and lowering interest rates • Households • Consumption more attractive than savings • “Durable” consumption (houses, cars, appliances) cheaper • Firms • Cost of investment (financing new capital equipment, construction, etc) cheaper Econ 7920/Chatterjee
Monetary Policy: Potential Pitfalls • Expansionary monetary policy may not be effective if • Expectations of future demand are severely depressed • The gap between actual output and potential output is small (can generate inflationary pressures) • The economy is in a “liquidity trap” • Prices are actually falling or expected to fall (deflation) Econ 7920/Chatterjee
A Liquidity Trap • When nominal interest rates reach a critically low level (positive but close to zero): people might prefer holding money to assets (why?) • In such cases, injecting more money does not affect interest rates and thereby the incentives to spend and invest Econ 7920/Chatterjee
Deflation • Deflation: price level declines over time • Due to declining productivity and demand • Gap between actual and potential output • Monetary policy is ineffective in a deflation: • Let r = real rate of interest i = nominal rate of interest = rate of inflation Then, r = i - With deflation, < 0 r > 0 Econ 7920/Chatterjee
Consider an example: • Suppose, due to an expansionary monetary policy, the nominal interest rate is low, at i= 1% • But prices are falling at the rate of 5% = -5% • Then, the real rate of interest is: r = i - = 1-(-5) = 6% • Therefore, the real cost of borrowing is 6% even though the nominal cost is only 1% • Facing a declining price level and a rising real interest rate, households and firms postpone spending • Monetary policy completely ineffective Econ 7920/Chatterjee
Japan in the 1990’s • 1980s: Under pressure from the Ministry of Finance, the Bank of Japan kept interest rates low • Economy “awash” with liquidity • Created speculative bubbles in equities and real estate • Economy started over-heating towards the end of 1980s • Inefficiencies in the corporate sector slowed productivity • Financial liberalization of 1980s: more competition among banks more risk-taking Econ 7920/Chatterjee
Japan in the 1990s • Yasushi Mieno takes over as Governor of the Bank of Japan in 1989: promises to “cool” economy down • Interest rate rises from 2.5% in Dec 1989 to 6% in Aug 1990 • Speculative bubble bursts in summer 1990: stock market falls by more than 40% • Firms and households significantly cut back on spending • Sharp economic slowdown begins in 1990:Land prices fell quickly, mortgage defaults and bankruptcies increased • Throughout the 1990s, Japan experienced deflation and was stuck in a liquidity trap, in spite of monetary policy interventions Econ 7920/Chatterjee
Getting out of a Liquidity Trap and Deflationary Spiral • “Irresponsible Monetary Policy” was proposed as a solution by Paul Krugman of MIT (1998): • Set an inflation target of 2-4% • Commit to the target and keep increasing money supply in a sustained fashion • Eventually, public start expecting future inflation • Currency starts depreciating • Spending, investment, and demand for exports restart the growth process… Econ 7920/Chatterjee
Fiscal Policy and Output • Fiscal policy (government spending, taxation, and subsidies) can be an effective tool in • a recession • when expectations of future demand are severely depressed • Keynes (1936): through deficit spending, a government can influence expectations of the private sector: • Deficit spending: government spends more than it receives in tax revenues (mainly financed through borrowing) • Government spending creates new jobs multiplier effect on the economy Econ 7920/Chatterjee
The Government Spending Multiplier • Basic idea: • An initial amount of government spending creates new incomes (through jobs created in the public sector) • A fraction of this new income is spent on goods and services generates new income and spending, and so on… • Similar to a “ripple” effect • The final increase in income and spending is much larger than the initial increase in government spending “multiplier effect” economic expansion • What about the deficit? • The income generated increases tax revenues over time, making the deficit sustainable Econ 7920/Chatterjee
The Multiplier Effect: An Example • Suppose people spend a “b” fraction of their income (marginal propensity to consume) • Example: b = 0.75 people spend $0.75 of every $1 of new income • The government increases spending by $1 • Total spending and income generated: Econ 7920/Chatterjee
The Multiplier Effect • In general, the multiplier effect is given by: • In our example, b = 0.75. Then, • Increase in income = • A $1 increase in government spending increases total income by $4 • Also referred to as the “income multiplier” • A multiplier effect can also be generated by cutting taxes (the “tax multiplier”) Econ 7920/Chatterjee
When does Deficit Spending Work? • If the economy’s capacity utilization rate (gap between potential and actual output) is well below 100% • When resources are idle (high unemployment and shut-down factories) producers can increase production without raising prices • As capacity utilization nears 100%, deficit spending can overheat the economy and create inflationary pressures smaller multiplier effect Econ 7920/Chatterjee
“Leakages” from the Multiplier • Factors that can reduce the size of the multiplier effect: • Government spending financed by higher taxes • New income is fully spent on imports (does not affect GDP) • New income is fully saved by households to provide for future expected tax increases (“Ricardian Equivalence”) • “Crowding Out” of private investment by raising market interest rates • Sometimes, the Central Bank may raise interest rates to offset any inflationary expectations (say, if capacity utilization is near 100%) Econ 7920/Chatterjee
Military Spending and Interest Rates in the United Kingdom1730-1920 Econ 7920/Chatterjee
How Large is the Multiplier? • The U.S. government uses a forecasting model developed by Data Resources Inc. (DRI) to estimate the potential effects of fiscal policy • Estimates of Fiscal Policy Multipliers: Econ 7920/Chatterjee
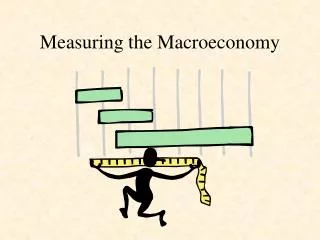
Unemployment (right scale) Real GNP(left scale) The Great Depression 240 30 220 25 200 20 billions of 1958 dollars 180 15 percent of labor force 160 10 140 5 120 0 1929 1931 1933 1935 1937 1939
THE SPENDING HYPOTHESIS • Asserts that the Great Depression was largely due to an exogenous fall in the demand for goods & services • Supporting evidence: • output, consumption, and investment declined steadily from 1929-1934 • Government spending remained largely unchanged during this period
THE SPENDING HYPOTHESIS: • Stock market crash exogenous fall in consumption • Oct-Dec 1929: S&P 500 fell 17% • Oct 1929-Dec 1933: S&P 500 fell 71% • Drop in investment • “correction” after overbuilding in the 1920s • widespread bank failures made it harder to obtain financing for investment (the FDIC did not exist then) • Contractionary fiscal policy • Congress raised tax rates and cut spending (deficits were considered “bad” for economy)
THE MONEY HYPOTHESIS • Asserts that the Depression was largely due to huge fall in the money supply • M1 fell 25% during 1929-33 • The severity of the Depression was due to a huge deflation: the price level fell 25% during 1929-33 • This deflation was probably caused by the fall in money supply