Download
1 / 15
150 likes | 276 Views
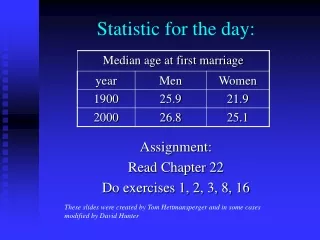
Statistic for the day: Tons of gold turned into wedding rings each year in US: 17. Source: Goldfield Mineral Services (London). Assignment: Exercises page 123-125: 5, 6, 10, 12, 14, 15. These slides were created by Tom Hettmansperger and in some cases modified by David Hunter.

E N D
Statistic for the day:Tons of gold turned into wedding rings each year in US: 17 Source: Goldfield Mineral Services (London) Assignment: Exercises page 123-125: 5, 6, 10, 12, 14, 15 These slides were created by Tom Hettmansperger and in some cases modified by David Hunter
Statistic for the day (the sequel):Hours prior to the start of class I’ll try to have the lecture notes posted online: 8 Source: A voice inside my head
Turning Data into Information: The distribution of the data • The shape of the distribution • Is it skewed or is it symmetric? • What is a typical value? • Should we use the mean or the median? • What is the spread of the distribution? • Should we use the standard deviation or the interquartile range? • What are the quartiles?
Age at Death of English Rulers 60, 50, 47, 53, 48, 33, 71, 43, 65, 34, 56, 59, 49, 81, 67, 68, 49, 16, 86, 67 Turning this data into information.
Shape: Stem and Leaf Display 1 1 6 1 2 3 3 34 8 4 37899 (4) 5 0369 8 6 05778 3 7 1 2 8 16
The Median and the Quartiles M Q1 Q3 (5) (5) (5) (5) 16 33 34 43 47 * 48 49 49 50 53**56 59 60 65 67***67 68 71 81 86 The first quartile is the number that divides the data into the first quarter and the last three quarters. The median divides the data into halves.
5 Number Summary • Median M = 54.5 • First Quartile Q1 = 47.5 • Third Quartile Q3 = 67 • Lowest = 16 • Highest = 86
Graphical of 5 number summary: Boxplot
Interpretations: • Median is a typical value. • Interquartile range = Q3 – Q1 and is a measure of spread of the data. It is the width of the middle 50% of the data. • Two data sets may differ in shapes, typical values (medians) or in spreads (IQR) or all three. • RESEARCH QUESTIONS WHEN TRANSLATED INTO STATISTICAL QUESTIONS BECOME: ARE THE DIFFERENCES SIGNIFICANT?
Question: Do men have larger handspans than women?Handspan: Distance in centimeters from tip of thumb to tip of little finger.What sort of study?
Data Men (n = 78) 23.5 22.5 23.5 23.0 24.5 20.5 22.0 22.0 22.5 21.5 24.5 24.5 21.0 21.0 20.5 22.0 22.0 19.0 22.0 22.0 20.0 21.0 21.5 22.5 22.5 24.5 24.0 23.5 20.0 22.5 24.0 21.0 23.0 23.0 22.5 21.5 20.5 20.5 21.5 20.5 21.0 22.5 21.0 22.0 23.0 21.0 24.0 22.0 21.0 21.0 23.0 24.0 22.0 22.5 21.5 23.5 22.0 18.0 23.5 24.0 24.5 23.0 22.5 24.5 22.0 22.0 24.5 24.0 21.5 22.0 Women (n = 89) 21.5 18.0 20.0 21.0 20.5 18.5 21.0 19.5 20.0 18.5 20.5 18.5 18.0 19.5 21.0 20.0 20.0 19.0 17.0 17.5 19.0 18.5 20.5 19.5 20.0 20.0 18.5 20.0 21.0 19.5 20.0 20.0 21.5 18.5 23.0 20.5 16.5 19.5 18.5 18.5 20.0 21.0 20.5 21.5 21.5 21.0 19.0 20.5 20.5 19.5 19.5 19.0 20.5 20.0 21.5 19.0 19.0 20.0 19.5 20.0 16.0 17.5 19.5 22.5 20.0 20.5 19.0 19.5 19.0 20.0 18.5 20.0 22.0 17.0 18.5 21.0 20.5 19.0 20.5 18.5 19.0 19.0 20.0 17.0 18.5 20.0 17.0 18.5 21.0
5-number Summaries Male IQR = 3 Female IQR = 2