Download
1 / 24
240 likes | 334 Views
Discover the benefits, challenges, and environmental impact of Pay-As-You-Throw waste disposal programs in the U.S. Learn about how PAYT works, types of programs, environmental research results, cost savings in cities, and growth in PAYT adoption. Find testimonials and lessons learned, plus EPA support and climate change impact. Explore various pricing systems and complementary programs, along with the growth and success of PAYT programs in cities like San Jose, San Francisco, Seattle, Austin, and Vancouver.

E N D
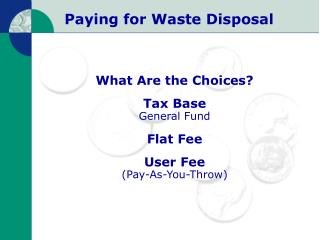
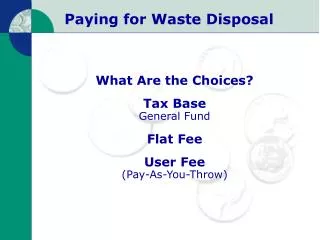
Paying for Waste Disposal What Are the Choices? Tax BaseGeneral Fund Flat Fee User Fee(Pay-As-You-Throw)
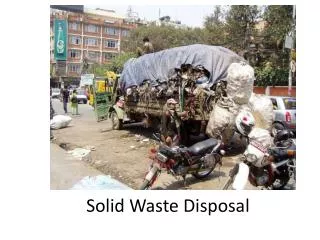
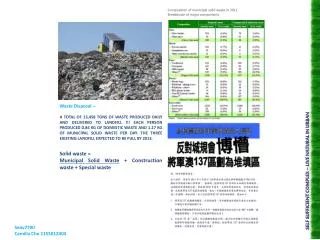
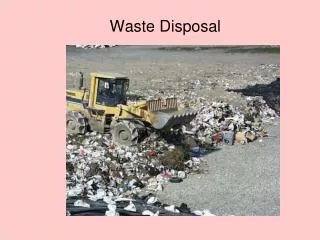
Challenges in MSW Management • More garbage to collect and dispose • Higher costs of collection services • Limited municipal budgets • Public-sector pressure to more cost-efficient
“3E” Benefits of Pay-As-You-Throw • Environmental Sustainability: Effectively promotes waste reduction • Economic Stability: Stable revenue covers cost of services • Equity: Economically fair delivery of services
How PAYT Programs Work • Pay for MSW service based on garbage thrown out • Pay for waste like a utility • Residents only pay for what they use
Types of PAYT Programs • Cans: Residents pay higher fees for larger containers • Bags: Residents pay a fee for garbage bags • Stickers: Residents pay for stickers affixed to bags/containers
Environmental Research Results • Duke University National Study • 14 to 27% average waste reduction • 32 to 59% increase in recycling • 19% found slight increase in illegal dumping
Examples of U.S. City Savings • Wilmington, NC— $400,000 (Population: 75,000) per year • Littleton, NH— $40,000 in extra funds(Population: 5,800) with PAYT • Gainesville, FL— $186,200 savings(Population: 96,000) • San Jose, CA— reduced cost by $4 (Population: 850,000) million annually
PAYT Growing in the U.S. • More than 5,000 communities in U.S. practice PAYT • Cities large and small, rural and urban • More than 60 cities with populations above 100,000 practice PAYT
Large Cities and PAYT City Population Recycling Rate San Jose, CA 782,248 43% San Francisco 723,959 Approx. 33% Portland, OR 437,319 50% (1996) Seattle 516,259 44% (1996) Worcester, MA 169,759 54% (1996)
What People Say about PAYT Approval from elected officials to environmental groups and residents • PAYT offers “a direct economic payback to the people”—San Jose elected official • High recycling rates in cities correlates with PAYT • Surveys indicate residential approval • Positive changes in consumer purchasing behavior
Lessons Learned from PAYT • Economic incentives encourage behavioral changes • Treating MSW services as a utility —you pay for what you use • Win-win: high recycling rate and economic stability
EPA Tools/Technical Assistance What is EPA doing to support PAYT? • Tool kit, PAYT Video, Fact sheets, Testimonials, Guidebook • Technical assistance workshops in cities across the U.S. • Web site: www.epa.gov/payt
Climate Change • PAYT helps reduce the greenhouse gas emissions associated with making, distributing, and disposing of products. • If 200 more communities adopted PAYT and reduced waste by 20%, greenhouse gas emissions would be cut by 3.8 million MTCE. • This equals taking almost 2.8 million cars off the road for almost a year.
Pricing Systems • Proportional • Variable • Two-tiered/ Multi-tiered
Complementary Programs • Curbside Recycling • Yard Trimmings and Composting • Bulky Items and White Goods
Growth in PAYT Programs No. of Communities Number of Communities Year
San Jose, California • Population Start Date Prgm. Type Container • 850,000 July 1993 Four-Sort Cans • Before PAYT: Unlimited collection for $12.50/month. • Before PAYT: Three 32-gallon garbage cans/week. • City reduced costs by over $4 million/year. • 87% of residents use the 32-gallon size container. • Recyclables/yard trimmings double pre-PAYT level. • Residents happy with program (80% approval in 1993, 90% in 1996).
San Francisco, California • Population Start Date Prgm. Type Container • 723,959 1900s Variable Cans • PAYT program one of the oldest in the country. • 1999: City recycling rate 42%. • “Fantastic 3” program: three 32-gallon carts. • First program to collect food scraps at curbside. • All apartment buildings have access to PAYT.
Seattle, Washington • Population Start Date Prgm. Type Container • 516,259 1981 Variable Cans • City offers 10, 20, 30, 60, or 90-gallon cans. • City uses totes, semi-automated collection for containers over 30 gallons. • 25% of resident use 20-gallon cans. • Water/trash bills issued jointly: City pays for trash, shuts off water.
Austin, Texas • Population Start Date Prgm. Type Container • 465,622 1991 Variable Cans • 2000: Recycling rate 28.5%. • 1991 (program began): Recycling rate 9.8%. • Switch to fully automated, one-person crews. • Residents can use 30-, 60-, or 90-gallon carts. • Excess garbage placed in bag with $2 sticker. • Bags without stickers charged $4/untagged bag.
Vancouver, Washington • Population Start Date Prgm. Type Container • 69,000 1990 Variable Cans • Second-can rate 84% greater than first can. • 500 residents switched to the mini-can. • Weekly recycling costs $3.10/month. • Set out 96 gallons of yard debris: $5.55/month. • City exceeded 50% recycling goal by 1995.
Portland, Maine • Population Start Date Prgm. Type Container • 64,000 1999 Variable Bags • Residents purchase bags for $0.68 each. • Pre-PAYT: No curbside recycling; recycling rate 7%. • After PAYT: Recycling rate now 35%. • Waste decreased by 80-100 tons/week. • City set up Q&A hotline before program began.
Wilmington, North Carolina • Population Start Date Prgm. Type Container • 64,513 1992 Two-tiered Cans • Combat illegal dumping: City used newspapers, radio, and TV. • Citizen focus groups gathered support. • 40-, 90-gallon roll-out carts collect waste weekly. • Biweekly pickup or stickers for overflow available. • Increase: 10% recyclables, 40% yard debris.