Download

1 / 29
290 likes | 327 Views
This project presents a mobile standalone photovoltaic generator with sensors to monitor solar parameters for energy analysis in remote areas. Sensors track current, voltage, energy storage, loads, solar radiation, and temperature, interfacing with a computer for data analysis using C sharp software. The project aims to evaluate photovoltaic energy feasibility, performance, and environmental conditions, including transportation to remote sites. Components include a Photovoltaic generator, Measurement system, and Monitoring software. The system features a Photovoltaic array, Storage system, Power conditioning system, and measurement tools like current and voltage sensors, solar radiations sensors, and temperature sensors. The PV system design includes charge controllers and inverters to manage energy production, storage, and release efficiently. Solar radiation, temperature, and other parameters play crucial roles in optimizing photovoltaic system performance. Witness the connection between solar radiation variations and PV module behavior in this detailed project.

E N D
DESIGN OF MOBILE PV SYSTEM FOR MEASURING AND ANALYSING OF SOLAR PARAMETERS Prepared by: Hamzah Snouber For: Dr . I mad Breik
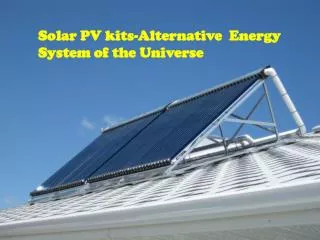
Abstract This project describes a recent work developed to create a mobile stand alone photovoltaic generator that can be easily relocated in remote areas to evaluate the feasibility of photovoltaic energy applications. A set of sensors were installed to monitor the electric current and voltage of the energy generated, the energy stored and the energy used by the loads that may be connected to the system.
Other parameters like solar radiations were installed and temperature sensor .This was done while considering the important role of temperature in the photovoltaic module performance. Finally, a measurement and communication hardware was installed to interface the system developed with a conventional computer. using c charp software.
The goals of This project Design and build a stand alone photovoltaic system containing all the components required to produce electricity from solar radiation. Develop a set of measuring and analyzing tools in order to evaluate the operation of the stand alone system including the related environmental conditions. Design and build a device, integrated to the stand alone system, that allows it to be transported to remote sites in order to evaluate its performance in specific environmental conditions.
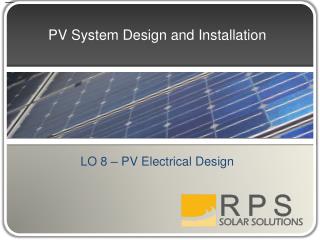
General description of the Energy Generation System In order to classify the parts of the energy generation system, considering its main functions, three main blocks were defined: Photovoltaic generator. Measurement system. Monitoring software.
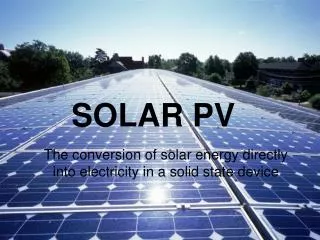
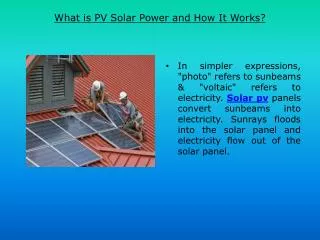
Photovoltaic generator The photovoltaic generator is the heart of the generation system. This generation block is formed by three main areas: Photovoltaic array. Storage system. Power conditioning system.
Storage system (batteries) It is known that a stand alone photovoltaic system needs a storage system to provide energy for the cases of inappropriate weather conditions, instantaneous overload conditions, or demand for energy after sunset. The selected storage system, in this case a bank of batteries, was configured considering the amount of energy that can be generated by the photovoltaic array and its electrical characteristics
Power Conditioning System The power generated by the photovoltaic array needs to be controlled in order to protect the life of the batteries and to provide adequate electrical energy to the loads connected to the system. Two power conditioning devices were specifically used in this case: Charge controller: to avoid overcharges or deep discharge cycles in the bank of batteries. Inverter: to provide power to AC loads.
Measurement system A flexible measurement system was designed to monitor the main parameters produced by the generation system and by the environmental conditions. In this way, the measurement system will be conformed by temperature sensors, solar radiation sensors, transducers of electrical parameters
The current and voltage sensor • This small voltage and current sense PCB was designed for use in the AttoPilot UAV autopilot system. DC current is determined by measuring • Voltage drop across a pair of parallel 1 milliohm shunt resistors (0.5milliohm together) then converted to final analog voltage output by the Texas. Instruments INA-169. Voltage sense is accomplished by • Scaling to 3.3V ADC range by a precision resistor divider. The current limit coincides with maximum power rating of the shunt resistors, 2 Watts each (4Watts total).
Why I use this sensor and what is purpose • to determine open circuit voltage and short circuit current • to determine the relationship between voltage and solar radiation • to charge the battery from the sun and notice the charge voltage • to notice the voltage wanted to the load from pv or from battery • to notice the current which the pv array produce and to evaluate the power from pv which is v*I and from battery which is v*i • to draw the iv characteristics • to draw the output power of pv verses time • identify the form factor and the max power point
Solar radiation • Cm11 are used solar radiation (kipp and zenon) and it will put in the horizontal surface in order to evaluate the solar radiation • Solar radiation is very important in my project and the standard solar radiation is 1000w\m2 • Now what is the importance of solar radiation on pv module • From our project we notice that if solar radiation increased Isc of the pv module increase and voc will be the same and the current will be saturated above 1000w\m2 .
Temperature sensor • Temperature plays an important role in photovoltaic generation Thus, in order to study the impact of temperature on photovoltaic generation • We study the relationship between pv and temperature and we notice that if the (T )is increase the vo.c is decreased according to the following equation : • Tcell=Tamb+.0256*G
LOSSE IN VOLTAGE DUE TO INCREASE TEMPRESURE • Vloss=-2mv\cell.1c • Vloss=-2*40*(Tc-Tstandard) • In that G=1043, T=28 • Tcell=28+.0256*1043=54.7C • Vloss=2m*40*(54.7-25)=2.37v • Vo.c =43.4+2.37=45.77v
The data logger • micro controller which I use in my project is pic16f877A • The PIC microcontroller is programmed to control the physiological data collection. All of these operations require controlled timing which was achieved by the use of timers.
WHY I SELECT PIC16F877A • LOW OPERATING VOLTAGE _ The PIC16LF877A has a wide operating voltage range from 2.0 V to 5.5V. This feature makes it compatible with a low voltage source. • 8-BIT ANALOG TO DIGITAL CONVERTER_ the analog to digital converter in the PIC16LF877A can be set to either an 8 bit or a 10 bit ADC. • TIMERS_ the PIC16LF877A provide 3 timers. • 3-ADC channels_ for continuous monitoring of temperature, current and voltage, the microcontroller has to be equipped with at least three ADC channels. The PIC16LF877A has 8 ADC channels.
Monitoring software A software application was developed in the c charp programming environment to communicate with the ‘‘pic-c’’ measurement modules by means of a RS232 serial port. The main purpose of the software was to monitor, to store and to visualize the measured parameters from the stand alone photovoltaic system and from the environmental parameters related to the photovoltaic generation.
Screens of the software developed were classified in the following types considering their main function: Presentation screen. Measurement status screen. Global and specific real time measurement screens. Visualization screen of stored data