Download
1 / 1
10 likes | 166 Views
Cyber Physical Bacterial-Bots Using Short Range and Long Range Dependency Calculations Leslie Charles Mounteer Jr. 1 , Lindsey Kaye Stevens 1 Dr. Anhong Zhou 1 , Dr.Yangquan Chen 2 , Mentors 1 Biological & Irrigation Engineering Department,

E N D
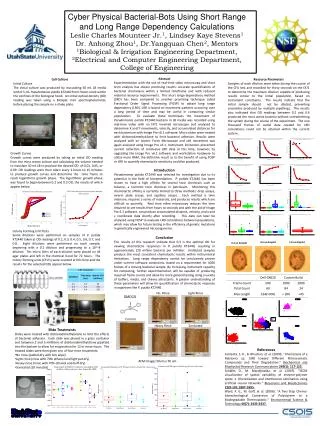
Cyber Physical Bacterial-Bots Using Short Range and Long Range Dependency Calculations Leslie Charles Mounteer Jr.1, Lindsey Kaye Stevens1 Dr. Anhong Zhou1, Dr.Yangquan Chen2, Mentors 1Biological & Irrigation Engineering Department, 2Electrical and Computer Engineering Department, College of Engineering Abstract Experimentation with the use of real-time video microscopy and short term analysis has shown promising results: accurate quantification of bacterial chemotaxis within a limited timeframe and with reduced material resource requirements. This short range dependency method (SRD) has been compared to another promising technique called Fractional Order Signal Processing (FOSP) to obtain long range dependency (LRD). LRD is based on movement patterns occurring over a long period of time and may be useful in comparing similar populations. To evaluate these techniques the movement of Pseudomonas putida KT2440 bacteria in LB media was recorded using real-time video with an IX71 inverted microscope and analyzed to determine X and Y movements, velocity, and accumulated distances for each bacterium with Image Pro v6.1 software. Micro slides were treated with dichlorodimethylsilane to limit bacterial adhesion. Results were analyzed with an Atomic Force Microscope and cell movement was again analyzed using Image Pro v6.1. Instrument limitations prevented current collection of conclusive LRD data at this time, however, by upgrading the Image Pro v6.1 software and workstation hardware to utilize more RAM, the definitive result as to the benefit of using FOSP or LRD to quantify chemotactic sensitivity could be produced. Introduction Pseudomonas putida KT2440 was selected for investigation due to its potential in the field of bioremediation. P. putida KT2440 has been shown to have a high affinity for several toxic chemicals such as toluene, a common toxic chemical in petroleum. Monitoring this chemotactic affinity is currently limited to three methods: drop assays, swarm plate assays, and capillary assays. Each method is time intensive, requires a series of materials, and produces results which are difficult to quantify. Real time video microscopy reduces the time required to see results from hours to seconds and with the aid of Image Pro 6.1 software, can produce accumulated distance, velocity, and x and y coordinate data shortly after recording. This data can later be analyzed using FOSP to evaluate LRD correlations between populations, which may allow for future testing in the efficiency of genetic mutations in genetically engineered microorganisms. Conclusion The results of this research indicate that 0.3 is the optimal OD for viewing chemotactic responses in P. putida KT2440, resulting in approximately 120 million bacteria per milliliter. Undiluted samples produce the most consistent chemotactic results within instrumental limitations. Long range dependency cannot be conclusively proven under current software constraints, based on a requirement for 1000 frames of a moving bacterial sample. By increasing instrument capacity for computing, further experimentation will be capable of producing required frame counts and allow for more general testing using a variety of buffers, media, and chemo attractants. A greater understanding of these parameters will allow for quantification of chemotactic response in organisms like P. putida KT2440. Cell Culture Initial Culture The initial culture was produced by inoculating 50 mL LB media with 0.5 mL Pseudomonas putida KT2440 from frozen stock within the confines of the biological hood. An initial optical density (OD) reading was taken using a BioSpec mini spectrophotometer, before placing the sample on a shake plate. Resource Parameters Samples of each dilution were taken during the course of the CFU test and recorded for thirty seconds on the IX71 to determine the maximum dilution capable of producing results similar to the initial population, based on instrument constraints. The results indicate that the initial sample should not be diluted, preventing anomalies produced by multiple pipettings. The results also indicated that OD readings between 0.2 and 0.4 produced the most active bacteria without overwhelming the system during the course of the experiment. The one thousand frames of useful data needed for LRD calculations could not be attained within the current system . Growth Curves Growth curves were produced by taking an initial OD reading from the most recent culture and calculating the volume needed to inoculate 50 mL LB to produce the desired OD of 0.01, 0.05, or 0.09. OD readings were then taken every 2 hours to 15 minutes to produce growth curves and determine the time frame to reach logarithmic growth phase. The logarithmic growth phase was found to begin between 0.2 and 0.3 OD, the results of which appear below. Colony Forming Unit Tests Serial dilutions were performed on samples of P. putida KT2440 taken at OD readings of 0.2, 0.3, 0.4, 0.5, 0.6, 0.7, and 0.8. Eight dilutions were performed on each sample, beginning with a 0.1 dilution and progressing to a 10^-8 dilution. Ten micro liters of each dilution were placed on LB agar plates and left in the chemical hood for 72 hours. The colony forming units (CFU’s) were counted at this time and the results for the selected ODs appear below. 0.5 uL droplet 1.0 uL droplet 0.2 uL droplet No Rinse Light Rinse DMDCS Control Heavy Rinse Sonicated • Slide Treatments • Slides were treated with dichlorodimethylsilane to limit the effects of bacterial adhesion. Each slide was placed in a glass container and between 2 and 5 milliliters of dichlorodimethylsilane pipetted into the bottom to allow for evaporation for 12 or more hours. The treated slides were then given one of four rinse treatments: • No rinse (patted dry with kim wipe) • Light rinse (rinse with 70% ethanol and light pat dry) • Heavy rinse (rinse with 70% ethanol and buff dry) • Sonicated (10 minutes) References Samanta, S. K., B. Bhushan, et al. (2000). "Chemotaxis of a Ralstonia sp. SJ98 toward Different Nitroaromatic Compounds and Their Degradation." Biochemical and Biophysical Research Communications 269(1): 117-123. Schäfer, D., M. Maciejewska, et al. (2007). "SECM visualization of spatial variability of enzyme-polymer spots: 1. Discretisation and interference elimination using artificial neural networks." Biosensors and Bioelectronics 22(9-10): 1887-1895. Ward, P. G., M. Goff, et al. (2006). "A Two Step Chemo-biotechnological Conversion of Polystyrene to a Biodegradable Thermoplastic." Environmental Science & Technology 40(7): 2433-2437. AFM Images 50um x 50 um