
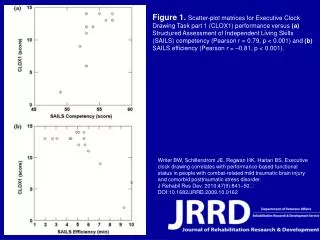
Figure 1. Scatter-plot matrices for Executive Clock Drawing Task part 1 (CLOX1) performance versus (a) Structured Assessment of Independent Living Skills (SAILS) competency (Pearson r = 0.79, p < 0.001) and (b) SAILS efficiency (Pearson r = –0.81, p < 0.001).

E N D
Presentation Transcript
Figure 1. Scatter-plot matrices for Executive Clock Drawing Task part 1 (CLOX1) performance versus (a) Structured Assessment of Independent Living Skills (SAILS) competency (Pearson r = 0.79, p < 0.001) and (b) SAILS efficiency (Pearson r = –0.81, p < 0.001). Writer BW, Schillerstrom JE, Regwan HK, Harlan BS. Executive clock drawing correlates with performance-based functional status in people with combat-related mild traumatic brain injury and comorbid posttraumatic stress disorder. J Rehabil Res Dev. 2010;47(9):841–50. DOI:10.1682/JRRD.2009.10.0162