Download
1 / 50
500 likes | 753 Views
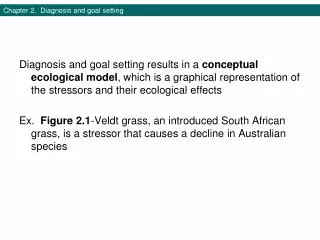
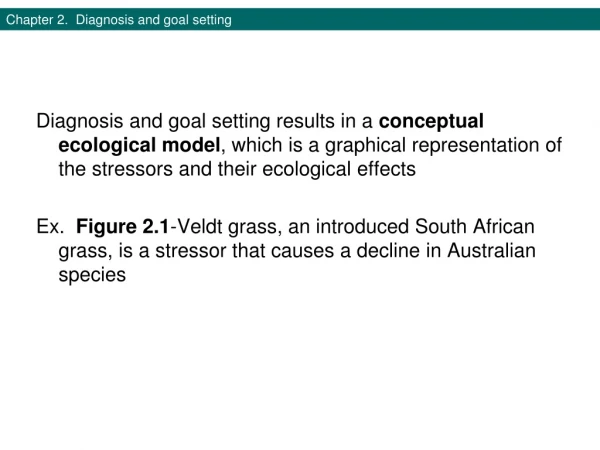
Chapter 2. Diagnosis and goal setting. Diagnosis and goal setting results in a conceptual ecological model , which is a graphical representation of the stressors and their ecological effects

E N D
Chapter 2. Diagnosis and goal setting • Diagnosis and goal setting results in a conceptual ecological model, which is a graphical representation of the stressors and their ecological effects • Ex. Figure 2.1-Veldt grass, an introduced South African grass, is a stressor that causes a decline in Australian species
Figure 2.1 Conceptual ecological model for 34 ha of degraded woodland, Kwinana, Western Australia
Drivers of ecological change • 1. Habitat conversion • 2. Pollution • 3. Overexploitation • 4. Introduced species • 5. Climate change • 6. Natural drivers like drought or disturbances caused by fires, floods, hurricanes, or volcanoes • Ex. Habitat conversion and subsequent pollution were the drivers that caused multiple stressors which caused ecological effects and affected ecological attributes • Figure 2.2- Biscayne Bay, Florida
Figure 2.2 A conceptual ecological model of Biscayne Bay (Florida, U.S.) used to assess the potential environmental impacts of resource use
Drivers of Ecological Change- 1. Habitat Conversion-Terrestrial
Figure 2.3 Approximately one-fourth of the Earth’s ice-free terrestrial surface is now cultivated
Drivers of Ecological Change- 1. Habitat Conversion-Aquatic • -aquaculture of fish and shrimp have caused 1/3 of the coastal mangrove forests to be lost in the past 50 years • -40% of the worlds population lives 50 km from coast and industry, urbanization, resort development seawalls, bridges, and jetties alter water and sediment movements Mangrove pneumatophores at Boca Chica on the Texas Coast. It is the only place in Texas with a mangrove forest or mangal.
Drivers of Ecological Change- 2. Pollution-Industrial sources • -result from energy production, manufacturing, mining, transportation, and waste incineration • -metals as well as spent nuclear fuel from energy production are toxic • -chemicals like polycyclic aromatic hydrocarbons (PAH) (from leaking oil and runoff; carcinogens), 150,000 synthetic chemicals with 1000s more manufactured each year in pesticides, solvents, acids, dioxin (chlorinated hydrocarbon that is toxic to humans formed during incineration and paper bleaching), phthlates (chemical used soften plastic toys that may be toxic and banned in 2008).
Drivers of Ecological Change- 2. Pollution-Agricultural and human habitation sources • -pathogens from livestock that in some cases can infect humans (anthrax, worms) • -salts from feeds and fertilizers can affect soils • -pharmaceuticals like hormones and antibiotics cause health problems with reproductive systems and bacterial resistance • -organic matter, fertilizers as well as nitrogen and phosphorous compounds cause eutrophication • -ash, particulates, and carbon dioxide contribute to respiratory problems and climate change Table 2.2
Figure 2.4 The Great Barrier Reef Marine Park designated no-fishing zones to allow populations of fish to recover like this Australian coral trout
Figure 2.5 Burmese pythons, such as the one held here by a park ranger, are popular pets in the United States and have created major ecological problems in Everglades National Park
Drivers of Ecological Change- 6. Natural drivers • -natural disturbances like hurricanes, floods, fire, or volcanic eruptions are major drivers of ecological change • -typical pattern of disturbance for an ecosystem is termed the disturbance regime Ex. Prairie pothole wetlands require drought once a decade so plant species that cannot germinate underwater can become established • -humans have changed the natural disturbance regimes of many ecosystems Ex. flood control structures on rivers and fire control policies • -ecosystem changes that are novel, too frequent, or too extensive cause unstablity
Figure 2.6 (A) The hydrology of Tram Chim National Park is managed to mimic historic flood pulses. (B) Flooded wetlands, provide habitat for many waterbirds and pulses maintain vegetation
Figure 2.7 Ecosystem disturbances (represented by blue dots) vary in frequency (vertical axis) and area (horizontal axis). Forest fires and tree gaps are less frequent relative to recovery time or disturb smaller portions than human-caused disturbances like smelter damage.
Ecological effects caused by the 6 drivers (habitat, pollution, overexploitation. introduction, climate, and natural drivers) - 1. Population declines 2. Habitat fragmentation; 3. Spread of introduced species 4. Changes in species interactions; 5. Changes in disturbance; 6. Changes in trophic structure • Population declines • Influenced by three factors: • Environmental stochasticity –caused by six drivers • Demographic stochasticity–erratic changes in birth and death rates of individuals • Genetic events • As populations decline there may be fewer alleles, less heterozygosity (Figure 2.8), and more maladaptive alleles. Natural selection can limit the incidence of these and promote adaptive alleles but small populations are more susceptible to inbreeding and genetic drift events like the founder effect • -the synergistic impact of negative effects of 1-3 can lead to an extinction vortex
Figure 2.8 (A) An allele is one form of a gene. (B) Each progeny inherits two alleles for every gene, one from each parent
Figure 2.9 The Tasmanian devil is a carnivorous marsupial endemic to the island of Tasmania and is in danger of extinction due to low genetic diversity and inability to combat a fatal disease
Ecological effects caused by the 6 drivers (habitat, pollution, overexploitation. introduction, climate, and natural drivers) - 1. Population declines 2. Habitat fragmentation; 3. Spread of introduced species 4. Changes in species interactions; 5. Changes in disturbance; 6. Changes in trophic structure • Habitat fragmentation (HF)
Figure 2.10 Deforestation in southern Bahia, Brazil has decreased biodiversity and adversely affected river water quality
Figure 2.11 Four different types of spatially structured populations. A nonequilibriummetapopulation (mp) loses its ability for migration as patches are lost and mp cease to persist
Ecological effects caused by the 6 drivers (habitat, pollution, overexploitation. introduction, climate, and natural drivers) - 1. Population declines 2. Habitat fragmentation; 3. Spread of introduced species 4. Changes in species interactions; 5. Changes in disturbance; 6. Changes in trophic structure • Introduced species that are invasive or form hybrids
Figure 2.12 Hybridization between the native California tiger salamander and an introduced tiger salamander yields hybrid progeny with a survival rate higher than that of either parent species
Ecological effects caused by the 6 drivers (habitat, pollution, overexploitation. introduction, climate, and natural drivers) - 1. Population declines 2. Habitat fragmentation; 3. Spread of introduced species 4. Changes in species interactions; 5. Changes in disturbance; 6. Changes in trophic structure • Changes in species interactions
Figure 2.13 A dune slack wetland is flanked by active dunes, some of which are being stabilized by woody vegetation. This woody vegetation is periodically removed to restore rare species that carry on species interactions within wetlands formed by shifting sands
Ecological effects caused by the 6 drivers (habitat, pollution, overexploitation. introduction, climate, and natural drivers) - 1. Population declines 2. Habitat fragmentation; 3. Spread of introduced species 4. Changes in species interactions; 5. Changes in disturbance; 6. Changes in trophic structure • Changes involving disturbance and succession
Ecological effects caused by the 6 drivers (habitat, pollution, overexploitation. introduction, climate, and natural drivers) - 1. Population declines 2. Habitat fragmentation; 3. Spread of introduced species 4. Changes in species interactions; 5. Changes in disturbance; 6. Changes in trophic structure • Changes in trophic structure
Figure 2.14 Changes in trophic structure with increasing nutrient loading in shallow temperate lakes in Europe
Figure 2.15 The Minneapolis Chain of Lakes is surrounded by the city of Minneapolis and has become degraded by phosporous in stormwater runoff, which dramatically changed the trophic system
Ecoregions and Landscape analysis • Ecoregions-geographic units corresponding to natural features
Ecoregions and Landscape analysis • Landscape-within an ecoregion, ecosystems and human uses form repeated patterns • -landscape analysis begins by delineating boundaries of the assessment area Ex. Problems related to nutrient transport, soil erosion, and flooding may involve landscape analysis of a drainage basin Fig. 2.16 • -may center on a site of interest based on rare or endangered species like rhinos and tigers in Chitwan National Park in Nepal, where landscape analysis was used to create buffer zones and restore forests in these areas Fig. 2.17
Figure 2.16 A drainage basin is the land that can contribute surface runoff or outflow to a waterbod like Hunters Creek in Rocky Mountain National Park in Colorado
Figure 2.17 The government of Nepal encouraged reforestation and sustainable forest management within buffer zones around Chitwan National Park to improve tiger and rhino habitat
Ecoregions and Landscape analysis • Landscape pattern (structure) refers to the configuration of different patches within the landscape and is usually represented using maps created with geographic information systems (GIS) • -GIS depicts patches of natural ecosystems or human-modified areas as well as linear features called corridors like rivers and roads Fig. 2.18 • -landscapes may be categorized by degree of habitat destruction, connectivity, and level of modification into four levels of habitat destruction Fig. 2.19
Figure 2.18 Within a landscape, patches (P) are tracts with different land covers; corridors (C) are linear features such as rivers, roads, and fence lines
Figure 2.19 Landscapes can be classified by degree of habitat destruction and the connectivity and level of modification of the remaining habitat
Site Analysis • Baseline survey-current state of an ecosystem using data from field surveys • Reference sites-intact ecosystems used as comparisons to restored or managed sites Fig. 2.20 • -plants are often described by mapping vegetation communities and by compiling plant lists • -animals are surveyed in a similar fashion when sessile but mobile animals are surveyed to determine whether species are residents, use the site for breeding, rearing young, migration, or seasonally • -some species become rare because of human actions and others have always been rare Table 2.3 • -population viability analysis is used to determine if rare populations might persist using demographic data Ex. Tasmanian devil, p. 543
Figure 2.20 Reference and managed forests in the Upper Peninsula of Michigan
Assessment of Ecological Resilience • Ecological resilience-capacity of an ecosystem to withstand change or to recover after disturbance • -conferred by adaptations possessed by the species within an ecosystem that allow them to rebound after major changes • -extent of landscape alteration affects resilience Fig. 2.21
Figure 2.21 As the degradation of a restoration site and surrounding landscape increases, likelihood of rapid and full ecological restoration declines (indicated by size of circles)
Assessment of Ecological Resilience • Resilience and response to stress can be characterized as one of three models:
Assessment of Ecological Resilience • How do we know if an ecosystem fits a model that has a high chance of successful recovery? • -tools have been developed for particular regions and ecosystems by researchers that have worked in areas • Ex. Obura and Grimsditch (2009) developed a resilience assessment tool for coral reefs that uses 61 resilience indicators that cover aspects of nine factors: benthic cover, physical condition of the substrate and water, coral condition, coral population viability, coral associates, fish groups, connectivity to the seascape, as well as human impacts and management capacity Fig. 2.23
Figure 2.23 Measuring coral recruitment to assess the status of coral populations for a resilience assessment
SMART goals-Specific, measurable, achievable, reasonable, and time-bound • Specific-clearly capture a community or species to target for restoration • Ex. Restore marsh or grassland rather than just vegetation or improve habitat for a focal (flagship) species or group of species. In the restoration of Sweetwater Marsh in CA, the goal was to restore marsh vegetation to improve habitat for the light-footed clapper rail, a focal bird species • Measureable-Quantify levels of restoration and establish ways to evaluate progress toward goals. How does it compare to a reference ecosystem? • Achievable and Reasonable-Base goals on realistic assumptions. • Time-bound-Goals should specify the amount of time it will take to achieve them.
Goal setting for large-scale and high-risk restorations • Backcasting-a method for setting incremental goals to solve problems that will require long-term commitments and be strongly influenced by external forces with high potential to impede progress.