Download
1 / 32
320 likes | 461 Views
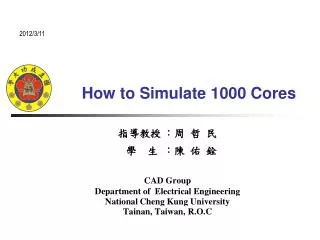
2012/3/11. How to Simulate 1000 Cores. 指導教授 :周 哲 民 學 生 :陳 佑 銓 CAD Group Department of Electrical Engineering National Cheng Kung University Tainan, Taiwan, R.O.C. Outline. Abstract Introduction The Framework Experimental Result Conclusion. Abstract.

E N D
2012/3/11 How to Simulate 1000 Cores 指導教授 :周 哲 民 學 生 :陳 佑 銓 CAD Group Department of Electrical Engineering National Cheng Kung University Tainan, Taiwan, R.O.C
Outline • Abstract • Introduction • The Framework • ExperimentalResult • Conclusion
Abstract • This paper proposes a novel methodology to efficiently simulate shared-memory multiprocessors composed of hundreds of cores. • The basic idea is to use thread-level parallelism in the software system and translate it into core-level parallelism in the simulated world. • To achieve this, we first augment an existing full-system simulator to identify and separate the instruction streams belonging to the different software threads. • Our simulator allows a user to execute any multithreaded application in a conventional full-system simulator and evaluate the performance of the application on a many-core hardware. • The results also show that the proposed technique captures the intrinsic behavior of the SPLASH-2 suite, even when we scale up the number of shared-memory cores beyond the thousand-core limit.
Introduction(1/3) • Architectural variability of multi-core processors is rather broad: • many lightweight cores versus few heavyweight cores • shared memory versus private memory • These are only some of the architectural decisions that designers have to take and solve depending on their design goals and constraints. • Some many-core systems have already arrived [5, 9], and by simply applying Moore’s law it is likely that hundreds or thousands of cores on a single die will become a commodity in the upcoming years. • Nevertheless, simulating such a large Chip Multiprocessor (CMP) is an open problem for the computer architecture community. • Some existing simulators are able to simulate moderately-sized multi-core processors, although their low simulation speed and scalability limit them to tens of cores. • This paper describes a methodology to efficiently simulate a CMP of hundreds or thousands of cores using a full-system simulator.
Introduction(2/3) • Background • Our approach has its roots in direct-execution simulators like the Wisconsin Wind Tunnel (WWT) [21] and the Stanford Tango-lite [11]. • These simulators rely on the execution of the majority of an application on native hardware, with the simulator paying special attention only to those events that do not match the target architecture. • We borrow many concepts from these early tools, but we apply them in a different context: • we run the applications on a full-system simulator that provides isolation and hardware independence. • Since we want to simulate a number of cores much larger than that available in the host machine, we designed techniques to reorder the threads, as generated by the full-system simulator, similar to Tango-lite.
Introduction(3/3) • Contributions • The key contribution of this paper lies in how we translate thread-level parallelism from an application running in a full-system simulator into core-level parallelism to be exploited by a many-core simulator back-end. • we also have implemented an instruction stream compression scheme and added scheduling feedback to keep memory requirements under control. With these techniques, we can model large-scale future many-core systems on currently available hosts. • To achieve this goal, we retain some features of full-system simulation, but we give up some others. • Our tool is capable of almost seamless execution of a multithreaded application, given that the source code is minimally annotated. • It efficiently decouples functional and timing simulation , so that functional and timing modes can be interleaved. • Nevertheless, we do not currently exploit I/O device emulation and we discard parts of OS activity.
The Framework(1/16) Figure 1: High level view of the simulator.
The Framework(2/16) • An overview of the proposed framework is shown in Figure 1. • It is composed of three main parts: • a full-system functional simulator, • an interleavermodule (framed between the dashed lines) • a timing simulator. • The functional simulatorand the interleaveract as a front-end for the timing simulator, which consists of a collection of timing models for CPUs, caches, interconnect, and memories. • The functional simulator streams all executed instructions, including OS activity to the interleaver. We chose to discard those OS instructions that do not meaningfully match the target architecture. • we filter the instructions of the kernel scheduler, but we simulate all system calls except for I/O events. • the interleaver level separate instructions according to the thread they belong to, and dispatch them to the appropriate CPU model in the back-end.
The Framework(3/16) • From Threads to Cores • The first step in the process of mapping application threads to simulating cores is to identify the different threads running in the functional simulator. • In the Linux kernel both processes and threads are treated as tasks. • The OS scheduler is responsible for deciding which tasktakes the CPU at any given time, according to the OS schedulingpolicy and task priority. • In order to identify the different threads, We insert a special instruction in the OS scheduler code (_ _switch_to() function in the kernel code), telling our simulator the processID (PID) and threadID (TID) of the next task. • The interleaver uses the PID and TID to dispatch instructions to the appropriate queues.
The Framework(4/16) • The interleaver is the module that glues the functional simulator and the timing models. • dispatch phase:This module separatesthe instructions belonging to different threads. • issue phase : schedules the instructions for execution in the CPU models with the correct ordering. • This whole phase is the key of our methodology. It properly decouples the functional simulation and the timing simulation.
The Framework(5/16) • Algorithm 1 Instruction dispatch • whileglobal_queue.size() > 0 do • cpu = to_cpu(global_queue.front().threadID) • local_queue[cpu].push(global_queue.front()) • global_queue.pop() • end while • instructions are moved from the global_queue to the local_queuesof their assigned CPUs. This mapping is done via the to_cpu() function. • In our case studies, which involve high-performance computing applications, this mapping is straightforward since these applications tend to spawn the same number of threads as hardware contexts available. • We use two special instructions to guide the allocation and de-allocation of threads to CPUs, namely THREAD_BEGINand THREAD_END.
The Framework(6/16) • Algorithm 2 Instruction issue • if every local_queue has at least one instruction then • for all non stalled local_queues do • execute(local_queue.front()) on cpu(local queue) • local_queue.pop() • end for • cycles = cycles + 1 • end if • The condition of the if statement checks for availability of instructions for all CPUs. • The forall loop does the actual scheduling of instructions to the local_queues. • In order to guarantee that instructions obey the execution flow, we buffer instructions until every local queue has at least one instruction. Only the local_queueswhose CPUs are not stalled can execute the instructions in the given cycle.
The Framework(7/16) • an example of a program spawning a thread that is executed concurrently with the master thread. • work(...) • { • THREAD_BEGIN; • /* do some work */ • THREAD_END; • } • ... • tid[0] = thread_create(&work,0); • work(1); • thread_join(tid[0]); • The beginning and end of each thread are marked with the special instructions THREAD_BEGIN and THREAD_END.
The Framework(9/16) • The THREAD_BEGIN calls activate the mechanism. After that, the local_queue[0] starts buffering instructions from the thread tid1. • Since no instructions from tid2are present in the local queue[1], none of the local queues can issue instructions. • As soon as instructions from tid2 are dispatched to its local_queue, the interleaver starts issuing instructions to both CPUs, and simulation time advances.
The Framework(10/16) • Synchronization • Simulating synchronization between threads involves several steps which change our dispatch and issuemechanisms: • (1) the synchronization event must be delivered to the interleaver • (2) the simulator must abstract from the time-dependent patterns that may depend on the machine emulated by the functional simulator • (3) the interleaver must respect the order imposed by the synchronization when issuing the instructions for execution. • The special instructions we chose to mark locks and barriers. • By having these special instructions at the beginning and end of any barrier and lock, the simulator can isolate the effects of time-dependent patterns (spinning) which are used in the implementation of most threading libraries. • The interleaveruses them to enforce the correct instruction ordering
The Framework(11/16) • an example of special instructions are applied to a barrier. • work(...) • { • ... • BARRIER_BEGIN; • barrier(); • BARRIER_END; • ... • } • When a local_queue has a BARRIER_BEGINas the head element, it cannot issue instructions • other queues can go on consuming instructions until they also reach a BARRIER_BEGIN. • The BARRIER_BEGIN also instructs the simulator to skip all instructions until a BARRIER_ENDis reached. • Once all threads reach the barrier, normal execution resumes.
The Framework(12/16) Figure 5: Diagram illustrating the execution of a barrier
The Framework(13/16) • example of a thread contending a lock that protects a critical section. • work(...) • { • ... • BEGIN_SLOCK(l); • lock(l); • END_SLOCK(l); • /*critical section*/ • unlock(l); • UNLOCK(l); • ... • } • SLOCK_BEGINand SLOCK_END delimit a spin lock, • while UNLOCK is placed soon after the actual unlock. • All instructions between the SLOCK_BEGINand SLOCK_ENDare skipped (spinning). • A thread acquires the lock at the SLOCK_BEGINand releases it at the UNLOCK. • Other threads trying to acquire the lock by performing another SLOCK_BEGINare stopped and cannot issue instructions till the lock is released.
The Framework(14/16) Figure 6: Diagram illustrating the execution of a lock
The Framework(15/16) • Taming Memory Usage • The buffering of instructions in the local queues can easily consume enormous amounts of memory. • This is especially evident for applications with heavy synchronization and unbalanced threads. • To keep memory usage under control we have devised an instruction compression technique in the local queues and a scheduling feedback mechanism. • The compression mechanism is implemented in the dispatch phase. • we perform an early branch prediction and encode only possible misses. • We perform address compression techniques both on instruction and data memory references by storing only the necessary bits to address cache lines.
The Framework(16/16) • The Linux scheduler in the guest OS may cause an unbalanced execution of threads, and this can be exacerbated if the threads that run longer have already generated a large number of instructions • All these instructions must be storeduntil we have instructions from all the threads ready for being issued. • To solve this, we have implemented a feedback mechanism to increase the priority of threads that are in waiting state in the guest OS. • When the interleaver detects that one of the local queues has ran out of instructions, it instructs the guest OS to increase the priority of the thread associated to this local queue. • The kernel scheduler then selects that thread for execution on the next time slice, and the empty local queue is filled with new instructions
SPLASH-2 Benchmarks • Stanford ParalleL Applications for SHaredmemory (SPLASH) • a suite of parallel programs written for cache coherent shared address space machines. • Cholesky: The blocked sparse Cholesky factorization kernel factors a sparse matrix into the product of a lower triangular matrix and its transpose. It is similar in structure and partitioning to the LUfactorization kernel, but has two major differences: • (i) it operates on sparse matrices, which have a larger communication to computation ratio for comparable problem sizes • (ii) it is not globally synchronized between steps. • Barnes: The Barnes application simulates the interaction of a system of bodies (galaxies or particles) in three dimensions over a number of time-steps, using the Barnes-Hut hierarchical N-body method • FMM: Like Barnes, the FMM application also simulates a system of bodies over a number of timesteps. However, it simulates interactions in two dimensions using a different hierarchical N-body method called the adaptive Fast Multipole Method
Result(1/7) • We use two datasets: DS1, the default dataset for SPLASH-2 and • DS2, a scaled up dataset. • For DS2, we tried to scale up the dataset by 16 times. • Our target is 1024 cores, while the original SPLASH-2 paper used 64 cores. • Hence, 1024/64 = 16X.
Result(2/7) • Table 3 shows the differences between the two sets of results. • Since we visually estimated the numbers, we only report those • differences greater that 5%. • For less that 16 cores, our results almost perfectly match those in the • SPLASH-2 paper, so we do not show the numbers in the table.
Result(3/7) fig.8 the amount of synchronization cycles out of the execution time for each benchmark and each configuration
Result(4/7) • Figure 8(a) shows the amount of synchronization cycles out of the execution time for each benchmark and each configuration. Our predictions (32 cores) also match those made in the SPLASH-2 paper, with few exceptions. • In Figure 9(a), we report the results for the scaling up to 1024 threads. Note that most benchmarks do not scale due to their small dataset, except for Barnes, which shows a moderatespeedup (280Xat 1024 cores). • Figure 9(b) shows the results we obtained by increasing the dataset. Some benchmarks (FFT, Water-Spatial, Ocean, and Radix) scale meaningfully (600Xat 1024 cores); we could indeed scale up the dataset of these benchmarks by at least 16X. • LU is an exception, since it is limited by the synchronization—it scales up to 380Xat 1024 cores. Other benchmarks scale less clearly since dataset, synchronization, and algorithm properties may interact.
Result(5/7) fig.9 the results for the scaling up to 1024 threads
Result(6/7) fig.10 simulation speed and memory usage
Result(7/7) • Figure 10(a) shows the simulation speed for all configurations. • The average simulation speed is around 1M instructions per second for 1 core. • For 1024, simulation speed decreases to 0.7M instructions per second . • Most of the additional slowdown is due to the synchronization. • For FMM and Cholesky, simulation speed drops by 50%. • Memory usage (reported in Figure 10(b)) is a critical aspect of our simulation flow. The upper bound for all applications and configurations is 8GB, corresponding to the memory installed in the simulation host used for the experiments. • many applications remain in the 3–4GB range and only a few grow up to nearly 8GB.
Conclusion • In this paper, we present an approach that represents an important first step towards the simulation of chip multiprocessors of an arbitrary number of cores. • Our approach is based on full-system simulation technology which is used to run a many-thread application, whose threads are dynamically mapped into independent cores. • Our experiments show that the simulator can scale up to 1024 cores with an average simulation speed overhead of only 30% with respect to the single-core simulation. • We successfully used our approach on the SPLASH-2 benchmark suite, giving meaningful insights on the intrinsic scaling behavior of these applications.