Download

1 / 21
210 likes | 398 Views
Urban Sprawl and UHI in Dallas and Minneapolis. Matthew Welshans, MGIS Student, Penn State University April 11, 2014 – Association of American Geographers Annual Meeting. Project Summary. Define Urban Heat Island (UHI) and Urban Sprawl Explore Data Used in Project Methodology for Project

E N D
Urban Sprawl and UHI in Dallas and Minneapolis Matthew Welshans, MGIS Student, Penn State University April 11, 2014 – Association of American Geographers Annual Meeting
Project Summary Define Urban Heat Island (UHI) and Urban Sprawl Explore Data Used in Project Methodology for Project Results Conclusions and Next Steps
Urban Heat Island Definition Image Source: US EPA (2012)
Why is Urban Heat Island a Concern? Kai Hendry (Flickr) Dr. Edwin Ewing/CDC Carrie Sloan (Flickr)
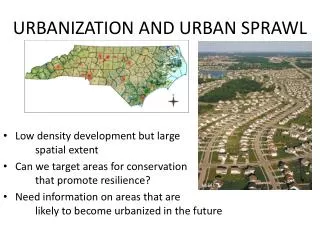
The Problem Urban Heat Island is affected by the growth of metropolitan areas • Size of heat island • Increase in temperature difference between rural/urban areas What is the correlation between increased urban sprawl and the change in urban heat island?
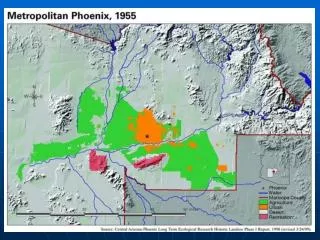
Study Areas • Dallas-Ft. Worth-Arlington, TX MSA • 12 counties in northeast Texas • 2010 Population: 6,426,214 • 9,286 square miles (~690/sq mi) • Minneapolis-St. Paul, MN/WI MSA • 11 counties in southeast Minnesota and 2 in western Wisconsin • 2010 Population: 3,759,978 • 6,364square miles (~590/sq mi)
Data Sets • Land Use/Land Cover Data (2001, 2006, 2011 Draft) • National Land Cover Database (Landsat 7) • Split into 15 land cover categories • Percent Impervious Surface (%IS) calculated per each pixel • Temperature Data • Derived from ASTER Imagery from the MODIS Satellite • Three swaths per study area were chosen based within 2 years of the LULC Data.
Why ASTER For Temperature Data? From ASTER User Handbook Version 2 (2002)
Deriving Temperatures from ASTER Temperature calculated using Gillepsie et al (1998)’s Temperature Emissivity Separation (TES) Method for each image. • Atmospheric Scattering effects filtered out • Max and min pixel emissivity calculated • Surface temperature ± 1.5°C calculated using Planck’s Law
Methodology Split each study area into eastern and western sections Sampled each swath extent with ~10,000 points Averaged temperatures in each land cover category Averaged temperatures based on 10-percent intervals in percent impervious surface (IS) Calculated average Urban (>15% IS) and Rural (<15% IS) to produce UHI calculation
Why The Difference? Daytime Surface Albedo (reflectivity) • Higher in cleared areas versus water, wetlands, and forest • Proportional to surface temperature • Differs depending on time of year
Conclusions Generally good link between temperature and percent impervious surface Land cover type plays key role in daytime surface temperature patterns • Lower temperatures around water, forests • Highest temperatures in urban, agriculture, grassland
Next Steps Compare 2011 and upcoming 2016 land cover data to newer ASTER imagery See if trends continue to hold up Compare to nighttime imagery if possible to see how UHI patterns differ. Reverse Migration and Green Initiatives
Acknowledgements Dr. Jay Parrish – Advisor Beth King and Dr. Doug Miller – Penn State MGIS Program Jon Dewitz, Joyce Fry, Dr. Jim Vogelmann – USGS EROS Center Questions? maw323@psu.edu


![Urban Sprawl [Date] Today I will: Know the causes, problems and solutions to Urban Sprawl.](https://cdn1.slideserve.com/1949902/slide1-dt.jpg)