Download
1 / 20
200 likes | 388 Views
Biostatistics course Part 6 Normal distribution. Dr. en C. Nicolas Padilla Raygoza Department of Nursing and Obstetrics Division of Health Sciences and Engineering Campus Celaya Salvatierra University of Guanajuato Mexico. Biosketch. Medical Doctor by University Autonomous of Guadalajara.

E N D
Biostatistics coursePart 6Normal distribution Dr. en C. Nicolas Padilla Raygoza Department of Nursing and Obstetrics Division of Health Sciences and Engineering Campus Celaya Salvatierra University of Guanajuato Mexico
Biosketch Medical Doctor by University Autonomous of Guadalajara. Pediatrician by the Mexican Council of Certification on Pediatrics. Postgraduate Diploma on Epidemiology, London School of Hygine and Tropical Medicine, University of London. Master Sciences with aim in Epidemiology, Atlantic International University. Doctorate Sciences with aim in Epidemiology, Atlantic International University. Professor Titular A, Full Time, University of Guanajuato. Level 1 National Researcher System padillawarm@gmail.com
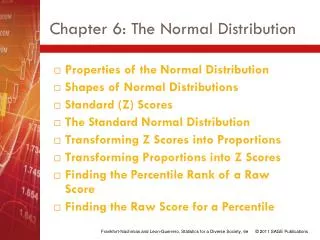
Competencies • The reader will define what is Normal distribution and standard Normal distribution. • He (she) will know how are the Normal and standard Normal distribution. • He (she) will apply the properties of standard Normal distribution. • He (she) will know how standardize values to change in a standard Normal distribution.
Introduction • We know how calculate probabilities and to find binomial distribution. • But, there are other variables that they can take more values that only two. • If they have a limited number of categories, are categorical variables. • If they can take many different values, are numeric variables.
Quantitative variables • They can take many values and are negative or positive.
Quantitative variables • What happen if the sample size is more big? • Changed the histogram?
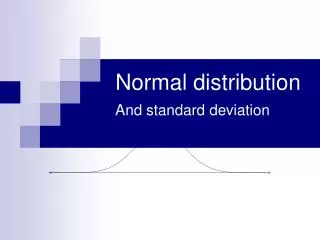
Quantitative variables • The distributions of many variables are symmetrical, specially when the sample size is big.
Normal distribution • It is used to represent the distribution of values that they should observe, if we include all population. It show the value distribution, if we repeat many times the measure in a great population. • Because of this, Y axis of Normal distribution is called probability. • An histogram show the value distribution observed in a sample. • An Normal plot show value distribution that it is thinking that they can occur in the population of which the sample was obtained.
Normal distribution • We can use the Normal distribution, to answer questions as: • What is the probability of a adult man has a glycemia level < or = to 50 mg/100 ml? • We can answer, taken the percentage of observed men, with glycemia levels < 150 mg/100 ml.
Normal standard distribution • Normal distribution is defined by a complicated mathematical formulae, but we have published tables that define area under the Normal curve: Normal standard distribution. • In this the mean is 0 and standard deviation is ±1. • These tables are in statistic textbooks.
-1 0 +1 Normal standard distribution • When Z=0.00 is 0.5 • When Z = 1.00 is 0.159 or 0.841
-1 0 +1 Normal standard distribution • Many times, we want the range out of area of curve. • Area out of range is complementary to the range in of area of the curve.
Normal standard distribution • Area out of range is that we shall use with more frequency. • There are tables published with these values and they are the table with two tails.
Standardized values • Any Normal distribution can be changed in a Normal standard distribution. • To standardize value, we subtract of each value its mean and it is divided by standard deviation. • Example • Mean of stature is 1.58 mt with s = 0.12 • Standardized value for stature of 1.7 is 1.7 - 1.58/0.12 = 0.12/0.12 = 1.00
Standardized values • How we do apply the lessons learned? • What is the probability of one person in the population, has less than 1.6 mts of stature? • We know that should calculate what is the area under curve to the left of 1.6 mts, under a Normal curve with a mean of 1.58 and s of 0.12. • 1.6 -1.58/0.12 = 0.167 • Using the tables of Normal standard distribution p lower value (to the left of mean) for 0.167 is 0.5675 = 56.75%. • We can answer that the probability of an individual of this population has less than 1.6 mts is 56.75% • It is a population with low stature!
Standardized values • Cautions: • Sample size • We have used a sample of 1000 measures, if the sample size is less, the results are different. • Supposition: • The results depend of the supposition that statures are distributed Normally with the same mean and standard deviation found in the sample. • If the supposition is incorrect, the results are wrong.
Non-Normal distribution • Not all quantitative variables have a Normal distribution. • We measured levels of glycemia in 10 personas: the distribution are skewed. • Do we can use the properties of Normal distribution?
Non-Normal distribution • If, it is skewed to the right, we can apply logarithmic transformations. • If, it is skewed to the left, we squared each value. • Original values is transformed in natural logarithmic values (button “ln” in scientific calculators).
Bibliography • 1.- Last JM. A dictionary of epidemiology. New York, 4ª ed. Oxford University Press, 2001:173. • 2.- Kirkwood BR. Essentials of medical ststistics. Oxford, Blackwell Science, 1988: 1-4. • 3.- Altman DG. Practical statistics for medical research. Boca Ratón, Chapman & Hall/ CRC; 1991: 1-9.