Data Processing: Data Explorer
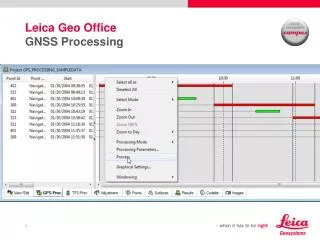
Data Processing: Data Explorer. Data Explorer User Interface. Processing history, Base Peak (apex) mass and intensity. Mass labels. User labels. Spectrum view (y-normalized). Output windows. Opening a Data File for Processing. F ile. 1. Start at “File|Open”. 2. Add each file


Data Processing: Data Explorer
E N D
Presentation Transcript
Data Explorer User Interface Processing history, Base Peak (apex) mass and intensity Mass labels User labels Spectrum view (y-normalized) Output windows
Opening a Data File for Processing File 1. Start at “File|Open” 2. Add each file to be opened to the selected list (up to 8 files) 3. Decide which *.set file to use 4. Click here to finish and open the selected file(s)
The Structure of the *.DAT file • mass spectra (could be more than one) • acquisition settings • processing settings • calibration info • result file exportable into *.BIC exportable into *.SET exportable into *.CAL
Useful Data Processing Tools • Basic processing features • Peak detection, peak labeling • Graphics • Resolution, S/N calculators • Baseline correction • Noise reduction, smoothing • Calibration (manual, automatic with the sequence controller) • Advanced processing features • Calculators (isotope, elemental, AA comp, etc.) • Peak deisotoping • Macros and integrated VBA support
Peak Detection/Basic Settings Peaks Intensity Threshold Area Threshold Data types are distinguished by assumed resolution: Mariner: 5000 Voyager linear: 2000 Voyager refl.: 10000 PS1: 7500
Peak detection : Application to data with noisy baseline w. 2% area threshold w. 2% intensity threshold “Noise peaks” are detected because of improper threshold setting
Peak Detection/Advanced Settings Peaks peak detection ranges Peak detection parameters can be set independently, range-by-range
Peak Detection/Advanced Settings Tryptic digest of E. coli beta galactosidase
Insert Peak Function Allows you to quickly add an undetected peak to the peak list Insert Peak Function detects and labels the peak in the range selected by right click-drag
Displaying the Peak List (Detected Peaks) Any column can be sorted - Click on heading to sort Spec Peak List tab in Output Window
Peak List Options Right-click on the Spectrum Peak List to enable these options Remove an unwanted detected peak by highlighting it in the Spec Peak List and clicking here
Peak Labeling Peaks Note: Peak Detection and Peak Labeling settings are saved in a *.set file Centroid Mass assignment is more accurate than Apex Note: Not all detected peaks will be labeled in any given view User-defined labels (e.g., applied by macros or *.lbs files) can be applied, removed or customized here Click on Apply to preview changes. Click on OK to apply changes and close
Peak Label Example: Mass Differences between adjacent peaks Polystyrene sample (theoretical difference 104 Da)
Spectral Display Options Up to eight spectra can be displayed at once Display Creates two copies of a trace; very useful to compare processed data with original Links zooming functions when two or more traces are displayed “Undo” processing by reverting back to original Spectrum #1 Allows a user-defined mass or intensity range to be displayed Go to Graphic Options to customize Spectra
Linking Traces Together Zoom functions are now linked for both traces Comparison of original trace vs Noise Reduction
Graphic Options Display Graphic Options… Note: Graphic settings can be saved in a *.set file
Data-type dependent defaults Default.set files contain the default information used for peak detection and display. These are found in the Voyager directory and can be changed by the user. VoyagerLinear.set DefaultLinearCal.set VoyagerReflector.set DefaultReflectCal.set VoyagerPSD.set Additional useful peak detection/display (*.set) files for specific data types can be found on the C: drive under Voyager/Settings/Voyager
To Overlay Traces File 1 File 2 Theoretical Isotope Pattern File 2 and the Theoretical Pattern are pasted onto File 1 as traces and linked together
To Overlay Traces Click on Display/Overlay Traces
Using the Resolution Calculator Select peak by right click-drag Calculated Resolution is displayed in the Output Window Results tab
Using the S/N Calculator Manual S/N Calculation allows user-defined noise selection Automatic S/N Calculation Calculated S/N is displayed in the Output Window Results tab
Baseline Correction Process Raw Data Corrected Data
Advanced Baseline Correction Value can be varied between 2 and 32767, higher value more smoothing sort of, so for broad protein peaks might want to use 1000 or higher etc, for peptide peaks less than 32 or 32 typically Process Value can be varied between 0 and 1, higher value more local correction being applied. Default value 0.5 works well for most applications Value can be varied between 0 and 1, higher value fits baseline more closely to the data. Default value 0.1 works well for most applications
Advanced Baseline Correction Raw Data Useful in processing noisy high mass spectra e.g., Protein, DNA samples Corrected Data
Types of noise reduction • Noise Removal ( true denoising) • Noise Filtering ( another true denoising) • Default ( resolution based smoothing) • Gaussian Smoothing ( classical smoothing)
Noise Removal • Noise Removal NR(2.00) • This program assumes that noise in the spectrum is white noise. The program reduces random fluctuations that are within the noise range. The noise range is set by the “Std Dev to remove” Number that the program requires. Typically this is set at 2 such that any signal below a 2:1 Signal to Noise ratio (RMS noise definition) is removed. This setting provides very aggressive denoising. A setting of 1 is less aggressive. The technique unlike classical smoothing does not reduce the resolution of the peaks to any significant degree. • Provides very aggressive denoising • Usually parameterless but may want to adjust from 2 to 1 to avoid spikes. • Retains as close as possible original peak resolution • Excellent for presentation purposes
With noise reduction Noise Removal raw data For the smoothing of high resolution data, Noise Removal is recommended
Noise Filtering • Noise Filtering NF(0.7) • Unfiltered noise is random and uncorrelated, while signals are highly correlated in that successive Y values progressively reduce from peak tops. The noise filtering program is designed to identify correlated and uncorrelated features in data so that only the uncorrelated noise components are filtered. The degree of correlation is the only parameter and determines how efficiently the noise is filtered with respect to the signals. This value typical varies from 0 to 1 with a common default of 0.7. Minimum resolution loss across peaks is typically observed. • Virtually parameterless as default of 0.7 best for most data. • Allows resolution to be maintained while reducing noise. • Retains small peak features near the baseline
Default Smoothing • Default (gaussian) smoothing RSM200 • This function is an advance on classical gaussian smoothing. The filter is changed across the mass range depending upon the resolution setting stated in the peak detection parameters. Classical smoothing will tend to over smooth at the low mass end and under smooth at the high mass end. The program is parameter less, but is dependent on the setting in the peak detection parameters. • Best on high mass data where lots of data points across a peak • Depends on correct peak detection parameters
Resolution-based smoothing 50 User specifies resolution (under Peak Detection); software chooses number of points to use depending on the mass.
Gaussian Smoothing • Smoothing SM353 • This the classical smoothing program which allows user interaction via setting the number of smoothing points ( from 3 up to 353). The program defaults to a “suggested” value for the acquired trace ( backhighlighted in blue) for ease of use. • This program is a known quantity. • Allows user input over a wide range • Data output can be compared with other data outputs
Gaussian Smoothing Process raw data smoothed data
Peaks from spectrum Manual Calibration Process Select a Reference File (*.ref) Export *.Cal File Reference masses From a *.ref file
Dialog to enter calibration masses manually Manually enter calibration mass here if not in *.ref file e.g., to recalibrate spectrum based on database search hit
Exporting a Calibration File Click here to select a filename and location for the saved *.cal file
Saving Your Work File
Additional types of Outputs Trace copied to clipboard List of masses and intensities copied to the clipboard Formatted peak list copied to clipboard
Using the Isotope Calculator Applications
The Ion Fragmentation Calculator Applications User specifies AA sequence and fragment types, • Calculator will: • Calculate fragment masses • Label fragment peaks • Create reference file
De-isotoping DI This is not just a method of removing the mass labels from peaks other than the mono-isotopic peak. This program reports a ‘stick’ spectrum where the only masses represented are those from the mono-isotopic mass and also where the height of that peak is representative of the summation of the areas of the peaks in each determined isotopic cluster. The program calculates the theoretical isotopic pattern at a given mass based on the given theoretical formula ( e.g.C6H5NO - a minimum common formula for all amino acids). Any deviation from the actual data and the theoretical can yield a hidden peak. The program severely simplifies complex reflector spectra, and is key for database search strategies.
Peaks Deisotoping overlapping isotope patterns “regular” isotope pattern Monoisotopic masses in overlapping isotope clusters are correctly identified Deisotoped spectrum can be more efficient for database searching. The deisotoping algorithm uses an assumed elemental composition [n(C6H5NO) for peptides] to collapse the isotope pattern.
Processing Tools • Data Explorer has a vast array of new features which add considerable power to the ability to process MALDI spectra. • There are 4 Noise Reduction techniques, of which 2 show particular power in retaining resolution while smoothing data. • The Default smooth option allows for a very fast way of smoothing data without setting parameters. • The deisotoping tool is a powerful way of simplifying spectra into genuine monoisotopic peaks. • Combining both noise reduction and deisotoping allows a dramatic improvement in protein identification from database searching 2D gel digests.