Download

1 / 41
410 likes | 566 Views
Integrating water quality into the planning process using a land use simulation model. Austin Troy*, Associate Professor, austin.troy@uvm.edu Brian Voigt*, PhD Candidate, brian.voigt@uvm.edu www.uvm.edu/envnr/countymode *University of Vermont Rubenstein School of Environment

E N D
Integrating water quality into the planning process using a land use simulation model Austin Troy*, Associate Professor, austin.troy@uvm.edu Brian Voigt*, PhD Candidate, brian.voigt@uvm.edu www.uvm.edu/envnr/countymode *University of Vermont Rubenstein School of Environment and Natural Resources Presented to NSF EPSCoR Water Workshop November 2008
Research Questions • What will land use patterns in Chittenden County look like in 20-30 years? • What effect will future urban development patterns have on environmental indicators, including carbon footprint, water quality, and habitat fragmentation? • How might alternative policies alter these outcomes? • How can we develop a model framework that effectively integrates the (inter)actions of households, employers, developers, transportation, and the environment?
Model components • UrbanSim: Land use model - www.urbansim.org • TransCAD (Caliper Corp.): four step travel demand model • Activity Model (RSG) • Traffic Microsimulator (Adel Sadek and RSG) • Suite of indicators and environmental modules
Database Output / Indicators Model Coordinator Scenario Data Control Totals TDM Exogenous Data The Five D’s of UrbanSim • Data-intensive • Disaggregated • Dynamic • Disequilibrium • Driven by trends and forecasts
Modeling with UrbanSim • Model parameters based on statistical analysis of historical data (same withTransCAD): • Regression • Choice modeling • Integrates market behavior, land policies, infrastructure choices • Simulates household, employment and real estate development decisions • agent-based for household and employment location decisions • grid-based for real estate development decisions from Waddell, et al, 2003
Grid_ID:23674 HSHLD_ID: 23 AGE_OF_HEAD: 42 INCOME: $65,000 Workers: 1 KIDS: 3 CARS: 4 Grid_ID:23674 Households: 9 Non-residential_sq_ft: 30,000 Land_value: 425,000 Year_built: 1953 Plan_type: 4 %_water: 14 %_wetland: 4 %_road: 3 Grid_ID: 60211 Employment_ID: 427 Sector: 2 Employees: 135 UrbanSim Decision Makers
DATABASE • Input Data • Economic • land value, employment • Structures • Residential and non-residential, size, year built • Biophysical • topography, soils, wetlands, flood plains, water • Infrastructure • roads, transit, travel time to CBD, distance to Interstate • Planning& zoning • land use, development constraints • Households • age of head of household, income, race, # of autos, children • Employment • employment sector, number of employees • Control Totals • people: total population, # of households • jobs: # of jobs by employment sector
Modeling with UrbanSim Accessibility Accessibility Land Price Land Price Mobility & Transition Mobility & Transition Location Choice Location Choice Real Estate Development Real Estate Development • movers • vacant units • probabilities • site selection Residential Land Share Residential Land Share
Modeling with UrbanSim Accessibility Accessibility Land Price Land Price Mobility & Transition Mobility & Transition Location Choice Location Choice Real Estate Development Real Estate Development New land development events in response to insufficient supply Residential Land Share Residential Land Share
Standard Indicators • Transport: VMT, accessibility • Land use: vacancy, non-residential sq ft • Land value: residential, commercial, industrial • Population: total, density, summarize by area (e.g. block group, TAZ) • Employment: count, type, sector • Residential units: count, type, income
Environment Indicators • Developing sub-modules that use UrbanSim output to estimate environmental impacts • Carbon footprint analysis (Jen Jenkins/RSG) • Mobile source pollutants (RSG) • Habitat fragmentation (Troy/David Capen) • Plant and soil impacts (Sarah Lovell/Deb Neher) • Stormwater (Breck Bowden/Mary Watzin) • To be integrated through Arc Objects framework
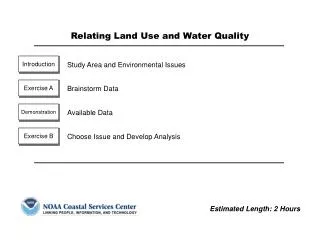
Water Quality Indicator Development (Bowden and Watzin) • Instrumented 6 sub-watersheds to estimate the impact of development intensity and traffic on various measures of water quality • 2 rural, 2 suburban, 2 highly developed
6 Sampling Watersheds Alder Mill Allen Potash Muddy Snipe
Indicators sampled • Stage, temperature, electrical conductivity, dissolved O2 • “Event loads” triggered by discharge events: • Total N and P • Sediment • Chloride
Outputs • Will have ability to ask • How these metrics are influenced by development intensity • How that changes seasonally • How relationship changes with different storm event intensities and antecedent conditions
Linking water quality to UrbanSim • UrbanSim grid-cell level outputs: • # residential units • Commercial sq. ft. • These are being calibrated against impervious area data to yield coefficients • These can vary as a function of population density, zoning, etc.
Percent impervious area by watershed: 1990 Predicted percent impervious area by watershed: 2030 • Coefficients can be used to estimate impervious area given standard UrbanSim ouputs: predicted residential units and commercial square footage
employment event alter transport infrastructure employment opportunity establish growth center(s) increase density UrbanSim and Scenario Analysis investment • What is a scenario? • Alteration of baseline model inputs and assumptions for comparison BASE YEAR – business as usual policy event 1 policy event 2 * need TranSims for this analysis
Scenarios: types of things that can be modeled • Constraints to development • Rules for density, use, coverage, zoning • Macro-scale transportation network (e.g. highways, onramps, roundabouts, etc.) • Micro-scale transportation network (e.g. new lanes, turning rules, ITS, speed limits) • Placement of public facilities (e.g. hospitals, schools, courts, parks, arena, airports, etc.) • Infrastructure (e.g. sewer, water, electricity) • Siting of major employers/employment centers • Speculative behavior assumptions (e.g. response of commuters and land market to high oil prices)
Five scenarios Developed through two large stakeholder workshops • Transportation corridor-oriented development • Investment for increased regional road connectivity • Population boom • County-wide growth center implementation • Green scenario: natural areas protection Combined last two for preliminary scenario run
Sample scenario : Natural areas combined with growth centers
Baseline vs. alternate: Zoomed in How does this translate into different environmental outputs?
Project Support • Dynamic Transportation and Land Use Modeling • Funder: USDOT Federal Highway Administration • TRC Signature Project 1: Integrated Land-Use, Transportation and Environmental Modeling: Complex Systems Approaches and Advanced Policy Applications. • Funder: UVM Transportation Center • Co Lead Investigator: Adel Sadek
Team and Collaborators • Graduate researchers: Brian Voigt, Alexandra Reiss, Brian Miles, Galen Wilkerson, Ken Bagstad • Co-PIs and collaborators: Adel Sadek, Stephen Lawe, John Lobb, Lisa Aultman-Hall, Jun Yu, Yi Yang, Jen Jenkins, Breck Bowden, Jon Erickson, Sarah Lovell, Deborah Neher, Mary Watzin, Julie Smith, David Novak, Roel Boumans, Chris Danforth, David Capen, Peter Dodds • Participants in Stakeholder Workshops • Collaborating organizations: • Resource Systems Groups, Inc, White River Junction, VT • Chittenden County Regional Planning Commission • Chittenden County Metropolitan Planning Organization • University of Washington Center for Urban Simulation and Policy Analysis: Paul Waddell, Alan Borning, HanaSevcikova, Liming Wang • UVM Spatial Analysis Lab • UVM Transportation Research Center • More information: www.uvm.edu/envnr/countymodel