Download
1 / 1
10 likes | 147 Views
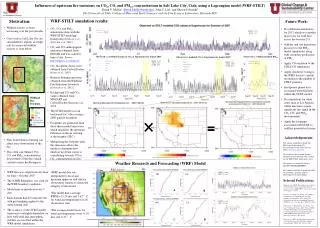
Influences of upstream fire emissions on CO 2 , CO, and PM 2.5 concentrations in Salt Lake City, Utah, using a Lagrangian model (WRF-STILT) Derek V. Mallia 1 ( Derek.Mallia@utah.edu ), John C. Lin 1 , and Shawn Urbanski 2

E N D
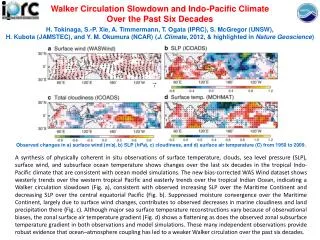
Influences of upstream fire emissions on CO2, CO, and PM2.5 concentrations in Salt Lake City, Utah, using a Lagrangian model (WRF-STILT) Derek V. Mallia1(Derek.Mallia@utah.edu), John C. Lin1, and Shawn Urbanski2 The University of Utah, College of Mines and Earth Sciences1 and the Fire Sciences Laboratory, Missoula MT2 WRF-STILT simulation results: Motivation: Future Work: • Wildfire activity as been increasing over the past decades • Cites such as Salt Lake City are surrounded by regions at a high risk for increased wildfire activity as seen below • Fires from biomass burning can affect areas downstream of the fire • This often can enhance CO2, CO, and PM2.5 concentrations downstream of the fires which can have major health impacts • CO2, CO, and PM2.5 simulations done with the WRF-STILT modeling framework [Nehrkorn et al., 2010; Lin et al. 2003] • CO2 and CO anthropogenic emissions obtained from EDGAR and was scaled by time of day. Source: • http://edgar.jrc.ec.europa.eu/ • CO2biospheric fluxes were obtained from CarbonTracker [Peters et al.,2007] • Biomass burning emissions obtained from the Wildland Fire Emissions Inventory [Urbanski et al., 2011] • Background CO and CO2 values obtained from MOZART and CarbonTracker[Emmons et al. 2010] • The STILT model was ran backwards for 3-days using a 2000 particle ensemble • Footprints are generated from these these model trajectories which quantifies the upstream influence on the air arriving at the receptor (SLC) • Multiplying the footprint with the emissions allows the model to determine how much an upstream source is contributing towards CO or CO2 concentrations in SLC • Do additional simulations for 2012 which was another major year for wild fires across the western U.S. • Add dry and wet deposition processes to the PM2.5. model simulations along with secondary production of PM2.5 • Apply CO oxidation to the STILT-CO simulations • Apply sensitivity testing to the WFEI dataset’s spatial resolution to the number of STILT particles • Incorporate plume rises associated with wild fires within the STILT model • Do simulations for other cities such as Los Angeles which may have a more significant fire signal in the CO2, CO, and PM2.5 measurements • Apply the footprints associated with STILT to wildfire potential risk maps Observed RMSE: 13.13 BIAS: 3.88 Modeled CO2 [PPM] Observed vs. modeled changes in CO2 at Sugarhouse for August 2007 Observed vs. wildfire modeled PM2.5 Observed vs. modeled CO at Sugarhouse for August 2007 RMSE: 12.16 BIAS: 4.01 CORR: 0.69 RMSE: 169 BIAS: 33.05 CORR: 0.52 Observed Modeled PM2.5 [ug/m3] CO [PPB] dCO2 [PPM] Wildland Fire Potential: Source: http://www.firelab.org/fmi/ Acknowledgements: The authors would like to thank Jim Ehleringer for providing CO2 measurements for the Salt Lake City Valley (http://co2.utah.edu) We would also like to thank Thomas Nehrkorn for providing the tools needed for the WRF-STILT model frame work This project was funded by NOAA GRANT: NA130AR4310087 The authors would like to thank the GCSC for providing a graduate student fellowship for for Derek Mallia Weather Research and Forecasting (WRF) Model WRF domain • WRF data was outputted every hour for June – October 2007 • The NARR Reanalysis was used for the WRF boundary condition • Model runs re-initialized every 7 days • Each domain had 40 vertical levels with grid nudging applied to the outer domain only • The accuracy of the STILT model trajectories are highly dependent on how well wind and atmospheric stability are resolved within the WRF model simulations • WRF model data was interpolated to local and upstream upper-air and surface observation stations to check the integrity of the model • The model had a average RMSE of 2.24 m/s and 1.62 °C for wind and temperature for all observation sites • The average model biases for wind and temperature were -0.10 m/s and -0.25 °C 12-km RMSE: 2.5 m/s BIAS: -0.5 m/s 00z 12z Selected Publications: Emmons et al, (2010). Description and evaluation of the Model for Ozone and related chemical tracers, version 4 (MOZART-4). Geoscience model development. 3. 43-67. Lin, J.C., C. Gerbig, S.C. Wofsy, et al. (2003), A near-field tool for simulating the upstream influence of atmospheric observations: The Stochastic Time-Inverted Lagrangian Transport (STILT) model, J. Geophy. Res., 108(D16), 4493. Nehrkorn, T., J. Eluszkiewicz, S.C. Wofsy, J.C. Lin, C. Gerbig, M. Longo, and S. Freitas (2010). Coupled Weather Research and Forecasting--Stochastic Time-Inverted Lagrangian Transport (WRF-STILT) Model, Meteorology and Atmospheric Physics, 107, 51-64. Peters et al., (2007), An atmospheric perspective on North American carbon dioxide exchange: CarbonTracker, PNAS, 104, 18925-18930. 4-km 1.3-km A B RMSE: 2.2 m/s BIAS: -0.9 m/s 00z 12z C D