Download
1 / 20
200 likes | 368 Views
Economic Impacts of RGGI: Following the Dollars. Paul J. Hibbard The Economic Impacts of the Regional Greenhouse Gas Initiative on the Ten Northeast and Mid-Atlantic States Raab Roundtable – February 2012. Study of the Economic Impacts of RGGI. Technical Advisory Group

E N D
Economic Impacts of RGGI: Following the Dollars Paul J. Hibbard The Economic Impacts of the Regional Greenhouse Gas Initiative on the Ten Northeast and Mid-Atlantic States Raab Roundtable – February 2012
Study of the Economic Impacts of RGGI • Technical Advisory Group • David Conover, Sr. VP, Bipartisan Policy Center • Richard Corey, Chief, Stat Source Div, CARB • Nathan Hultman, Director, Environmental Policy Program, School of Public Policy, University of MD • Brian Jones, Sr. VP, M.J. Bradley & Associates • John “Skip” Laitner, Director, Economic and Social Analysis, ACEEE • Michelle Manion, Climate & Energy Team Leader, NESCAUM • Brian Murray, Director for Economic Analysis, Nicholas Institute, Duke University • Karen Palmer, Senior Fellow, RFF • Eric Svenson, Sr. VP, Policy and Environment, Health and Safety, PSEG • Alexander “Sandy” Taft, Director, U.S. Climate Change Policy, National Grid • Foundation- Funded Study (11-2011): • Only requirement from the funders: independent, with full editorial control by Analysis Group team • Team: Paul Hibbard, Sue Tierney, Andrea Okie, Pavel Darling • Electricity Journal Article (12-2011)
What the study is… What the study is not… • Review of carbon reduction benefits • Review of environmental impacts • Evaluation of need for a carbon control program • Forecast of future program participation, effectiveness, results • Assessment of appropriateness of cap level • Analysis of carbon market • Economic study • …of actual revenues, actual programs, actual impacts • Following the money • …through the electric sector • …and through the macro economy • Measuring results
Bottom line results: • Net positive economic impacts for: • the 10 RGGI states together, and for each state participating in RGGI • Across the region, the initial $0.9 billion in CO2 allowance auction proceeds translates to $1.6 billion in net economic value added • Economic value results from the various ways states spent auction proceeds: • Biggest economic bang for buck: energy efficiency program support • Economic value also created by other ways money recirculates in local economies (e.g., customer bill rebates, general fund contributions)
Study Approach: Following the Money…. • Dollar Flows from RGGI Auction Proceeds through State Spending Impacts • Different states • Different programs • Different agencies • Different tracking methods • Different assumptions $912 million over 3 years Impacts (+ and -) in electric sector and larger economy during first three years of RGGI (2009-2011) Impacts in electric sector and larger economy (2009-2021)
Run the $ Through the Power System and the Economy… IMPLAN GE MAPS • Flow of Data • andModeling • Outcomes
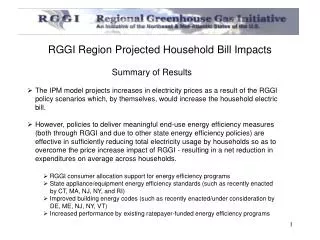
Auction and Direct Sales Proceeds $912 M • Downward trend in auction proceeds from 2009-2011 results from: • Fewer allowances sold over time • Lower allowance prices over time
Use of RGGI auction proceeds ($912 million)across the 10 states and in the 3 electric regions 10 RGGI states 6 New England States New York (NYISO) DE, MD, NJ (PJM) Source: Individual state reports and interviews.Note: Certain grant programs may include multiple components, and are categorized in the figure above based on the largest share of spending.
Overall economic impacts – 10 states • $1.6 billion – economic value added in the region (NPV*) • $0.9 billion – auction proceeds (mid-2008 through Q3 2011) • $1.1 billion – consumer savings (electricity customers) (NPV*) • $0.17 billion – consumer savings (natural gas & oil heat customers) (NPV*) • $1.6 billion – lower revenues to power plant owners (NPV*) • $0.77 billion – fewer dollars spent on out-of-region fossil fuel (NPV*) • 16,000 jobs – jobs created • 0.7 percent – average electricity bill increases during 3-year RGGI period [with savings over time given energy efficiency implemented with RGGI funds] • * Using a 3% social discount rate
New England New York PJM States (DE, MD, NJ)
Value Added Multipliers: Average impacts within RGGI states Energy Efficiency: Combines these various elements
Top 3 take-aways • RGGI cap/trade program integrated well with electric markets, and generated positive economic value, because… • Allowances were auctioned, capturing value for public use • Majority of funds used in ways that maximized economic benefit (energy efficiency)
A mandatory, market-based carbon control mechanism is functioning properly and can deliver positive economic benefits • Program has integrated seamlessly in regional power markets • States have collected/disbursed revenues, and worked cooperatively • RGGI reduces region’s payments for out-of-state fossil fuels • Reduced generation (due to lower consumption) reduces payment for fuels • Represents additional funds that stay mostly within state economies • A Region’s existing generating mix affects economic impacts • Carbon intensity of resource mix affects magnitude of impacts on revenues for power sector
The design of the CO2 market in the RGGI states affected the size, character, and distribution of public benefits • Decision by RGGI states to auction allowances transfers emission rights from public to private sector at a monetary cost • Retains value of allowances – and generates substantial revenue – for public use (preventing transfer of that value to plant owners) • Price impacts on electric markets the same either way
How allowance proceeds are used affects their economic impacts • States used funds in different ways, providing a wide variety of public benefits not captured in economic analysis • This does not decrease the value of different investment vehicles • However, how funds are used does affect economic impact • Energy efficiency investments have strongest positive economic impact • Reduces consumption (particularly for participants) • Depresses wholesale prices (for all) • Keeps impacts largely within electric sector • Other investments have strong returns, transferring value to other sectors of the economy • Direct bill assistance • General fund contributions • Education and job training
Positive job impacts with RGGI • Results in thousands of jobs more than non-RGGI case • 16,000 “job-years” • Reflects direct, indirect, induced jobs • Some may be temporary, others longer term • All associated only with first three years of program investments (but occur throughout the study period) • Jobs spread around economy, e.g. • Personnel doing energy efficiency audits • Installers of energy efficiency measures or renewable projects • Trainers, educators • State workers whose responsibilities might otherwise be eliminated due to budget challenges
RGGI’s first 3 Years of program investments point to some best practices • More rapid movement of revenues to investment vehicles speeds realization of benefits • Energy efficiency dominates benefit calculus • Standardization of tracking, measuring and verifying spending and results could reduce administrative burden of tracking progress and measuring benefits/costs • States have done a good job • But variation across states makes consistent tracking challenging
The states have used CO2 allowance proceeds creatively – supporting diverse policy and economic outcomes • Use of RGGI revenues has allowed states to meet a wide variety of social, fiscal, and environmental policy goals • Addressing budget challenges • Assisting low-income energy consumers • Restoring wetlands • Promoting advanced energy technologies • Assistance to municipalities and businesses through renewable and energy efficiency funding
Paul J. HibbardAnalysis Group111 Huntington Avenue, 10th Floor Boston, MA 20199phibbard@analysisgroup.com617-425-8171